29
/
en
AIzaSyAYiBZKx7MnpbEhh9jyipgxe19OcubqV5w
April 1, 2024
203208
Mozambique
MOZ
true
2
1
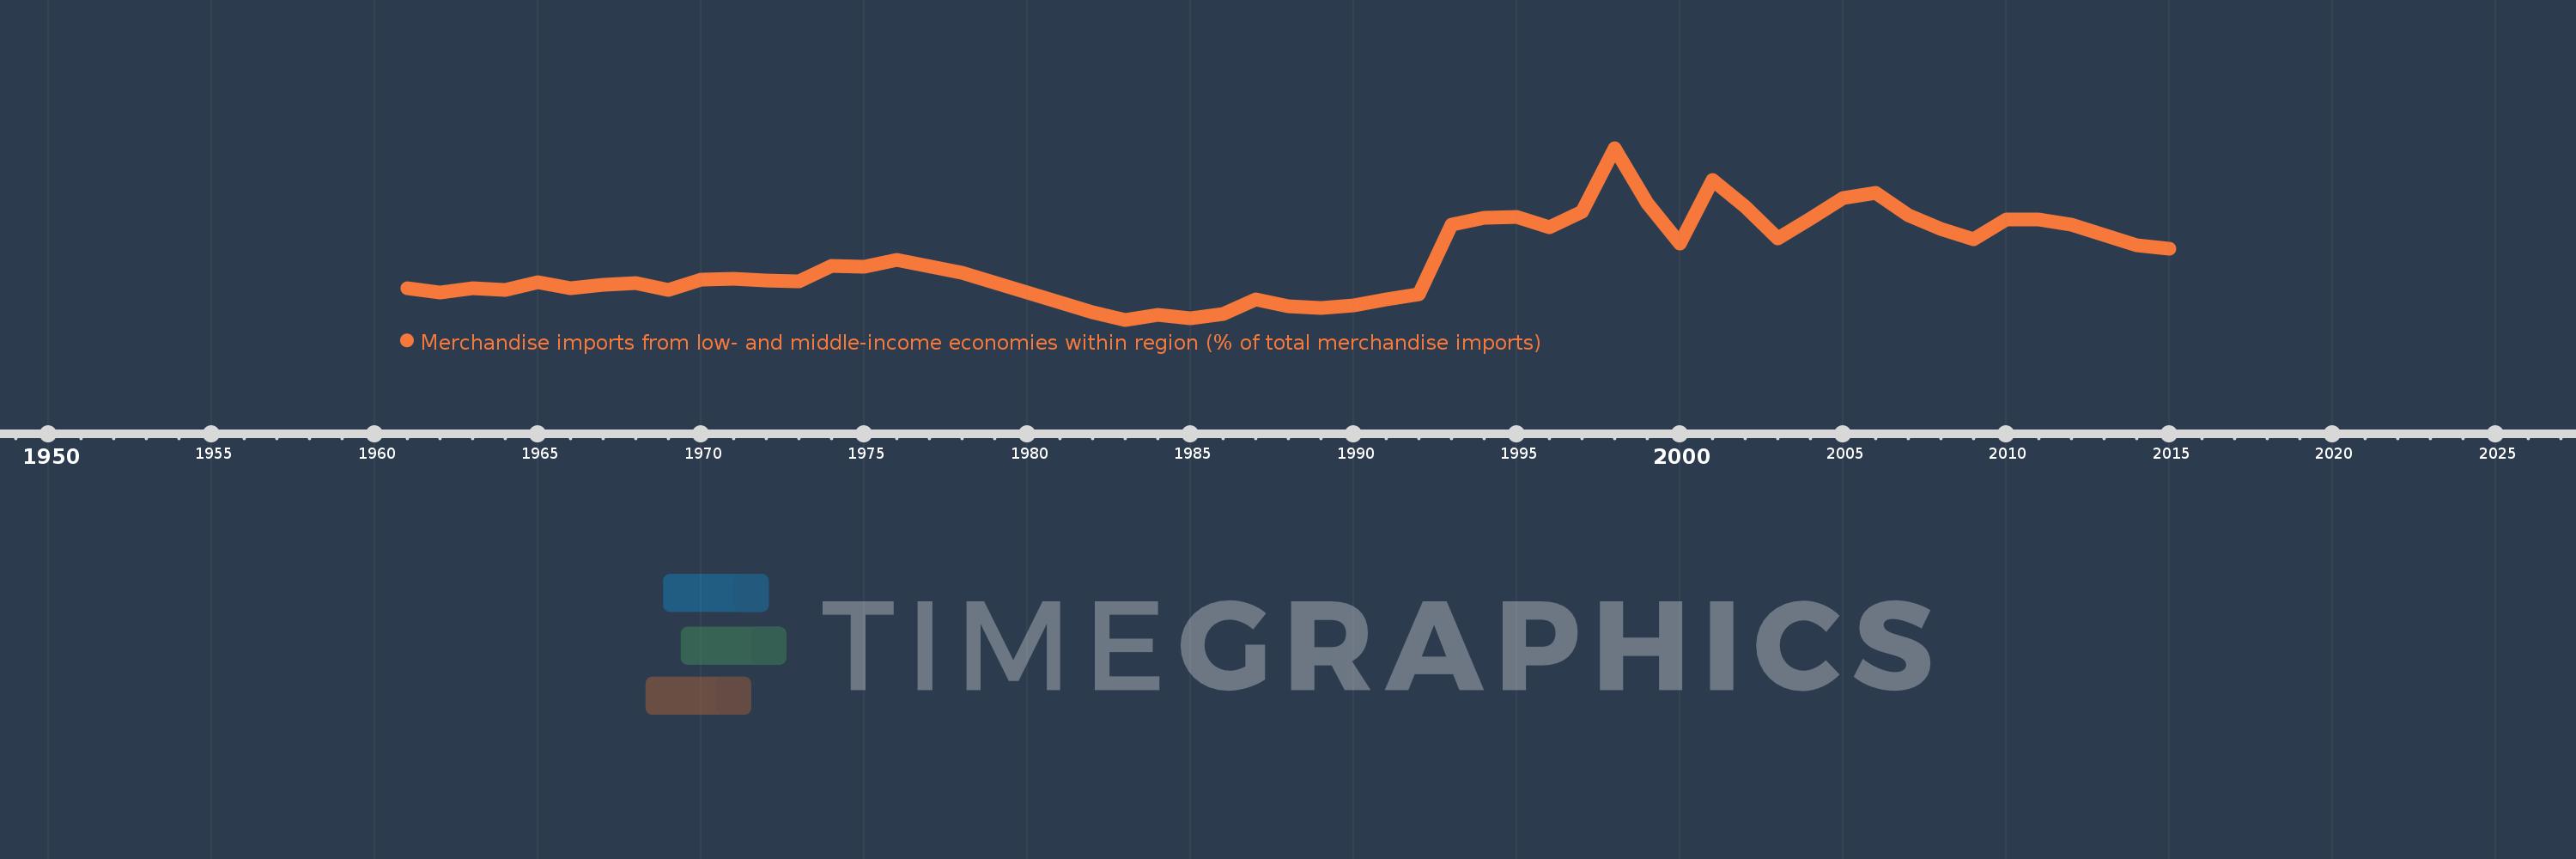
Merchandise imports from low- and middle-income economies within region (% of total merchandise imports)
2015,2014,2013,2012,2011,2010,2009,2008,2007,2006,2005,2004,2003,2002,2001,2000,1999,1998,1997,1996,1995,1994,1993,1992,1991,1990,1989,1988,1987,1986,1985,1984,1983,1982,1978,1976,1975,1974,1973,1972,1971,1970,1969,1968,1967,1966,1965,1964,1963,1962,1961
This statistics in other country:
Timeline:
This timeline shows a graph from 1961 to 2015 of Mozambique. No data until 1960. Number of actual observations by date: 51.
Source name:
World Development Indicators
Source organization:
World Bank staff estimates based data from International Monetary Fund's Direction of Trade database.
Categories, topics:
Private Sector, Trade
Last updated:
apr 23, 2017
Indicators value changes by year
Maximum:
62.544
jan 1, 1998
At the date of observation
Value
Absolute change
Change from previous value
jan 1, 1961
14.689
+14.689
0.0%
jan 1, 1962
13.243
-1.446
-9.84%
jan 1, 1963
14.855
+1.611
12.16%
jan 1, 1964
14.193
-0.662
-4.46%
jan 1, 1965
16.838
+2.645
18.64%
jan 1, 1966
14.881
-1.957
-11.62%
jan 1, 1967
15.883
+1.002
6.73%
jan 1, 1968
16.509
+0.626
3.94%
jan 1, 1969
14.292
-2.217
-13.43%
jan 1, 1970
17.583
+3.291
23.03%
jan 1, 1971
17.966
+0.383
2.18%
jan 1, 1972
17.287
-0.679
-3.78%
jan 1, 1973
17.09
-0.197
-1.14%
jan 1, 1974
22.479
+5.389
31.53%
jan 1, 1975
22.081
-0.398
-1.77%
jan 1, 1976
24.529
+2.448
11.08%
jan 1, 1978
19.923
-4.606
-18.78%
jan 1, 1982
6.513
-13.41
-67.31%
jan 1, 1983
4.055
-2.459
-37.75%
jan 1, 1984
5.707
+1.652
40.75%
jan 1, 1985
4.698
-1.01
-17.69%
jan 1, 1986
6.102
+1.404
29.88%
jan 1, 1987
11.026
+4.925
80.72%
jan 1, 1988
8.705
-2.321
-21.05%
jan 1, 1989
7.917
-0.788
-9.05%
jan 1, 1990
8.895
+0.978
12.35%
jan 1, 1991
11.117
+2.222
24.99%
jan 1, 1992
12.828
+1.71
15.38%
jan 1, 1993
36.495
+23.668
184.51%
jan 1, 1994
38.663
+2.168
5.94%
jan 1, 1995
39.196
+0.533
1.38%
jan 1, 1996
35.624
-3.573
-9.11%
jan 1, 1997
40.751
+5.127
14.39%
jan 1, 1998
62.544
+21.794
53.48%
jan 1, 1999
43.663
-18.882
-30.19%
jan 1, 2000
29.886
-13.777
-31.55%
jan 1, 2001
51.772
+21.887
73.23%
jan 1, 2002
42.457
-9.316
-17.99%
jan 1, 2003
31.669
-10.787
-25.41%
jan 1, 2004
38.538
+6.868
21.69%
jan 1, 2005
45.466
+6.928
17.98%
jan 1, 2006
47.113
+1.646
3.62%
jan 1, 2007
39.513
-7.599
-16.13%
jan 1, 2008
34.838
-4.675
-11.83%
jan 1, 2009
31.406
-3.432
-9.85%
jan 1, 2010
38.311
+6.905
21.99%
jan 1, 2011
38.078
-0.233
-0.61%
jan 1, 2012
36.286
-1.792
-4.71%
jan 1, 2013
32.87
-3.416
-9.41%
jan 1, 2014
29.402
-3.468
-10.55%
jan 1, 2015
28.315
-1.087
-3.7%
Ranking of countries by current statistics by years


Comments: