29
/
en
AIzaSyAYiBZKx7MnpbEhh9jyipgxe19OcubqV5w
April 1, 2024
228786
Romania
ROU
true
2
1
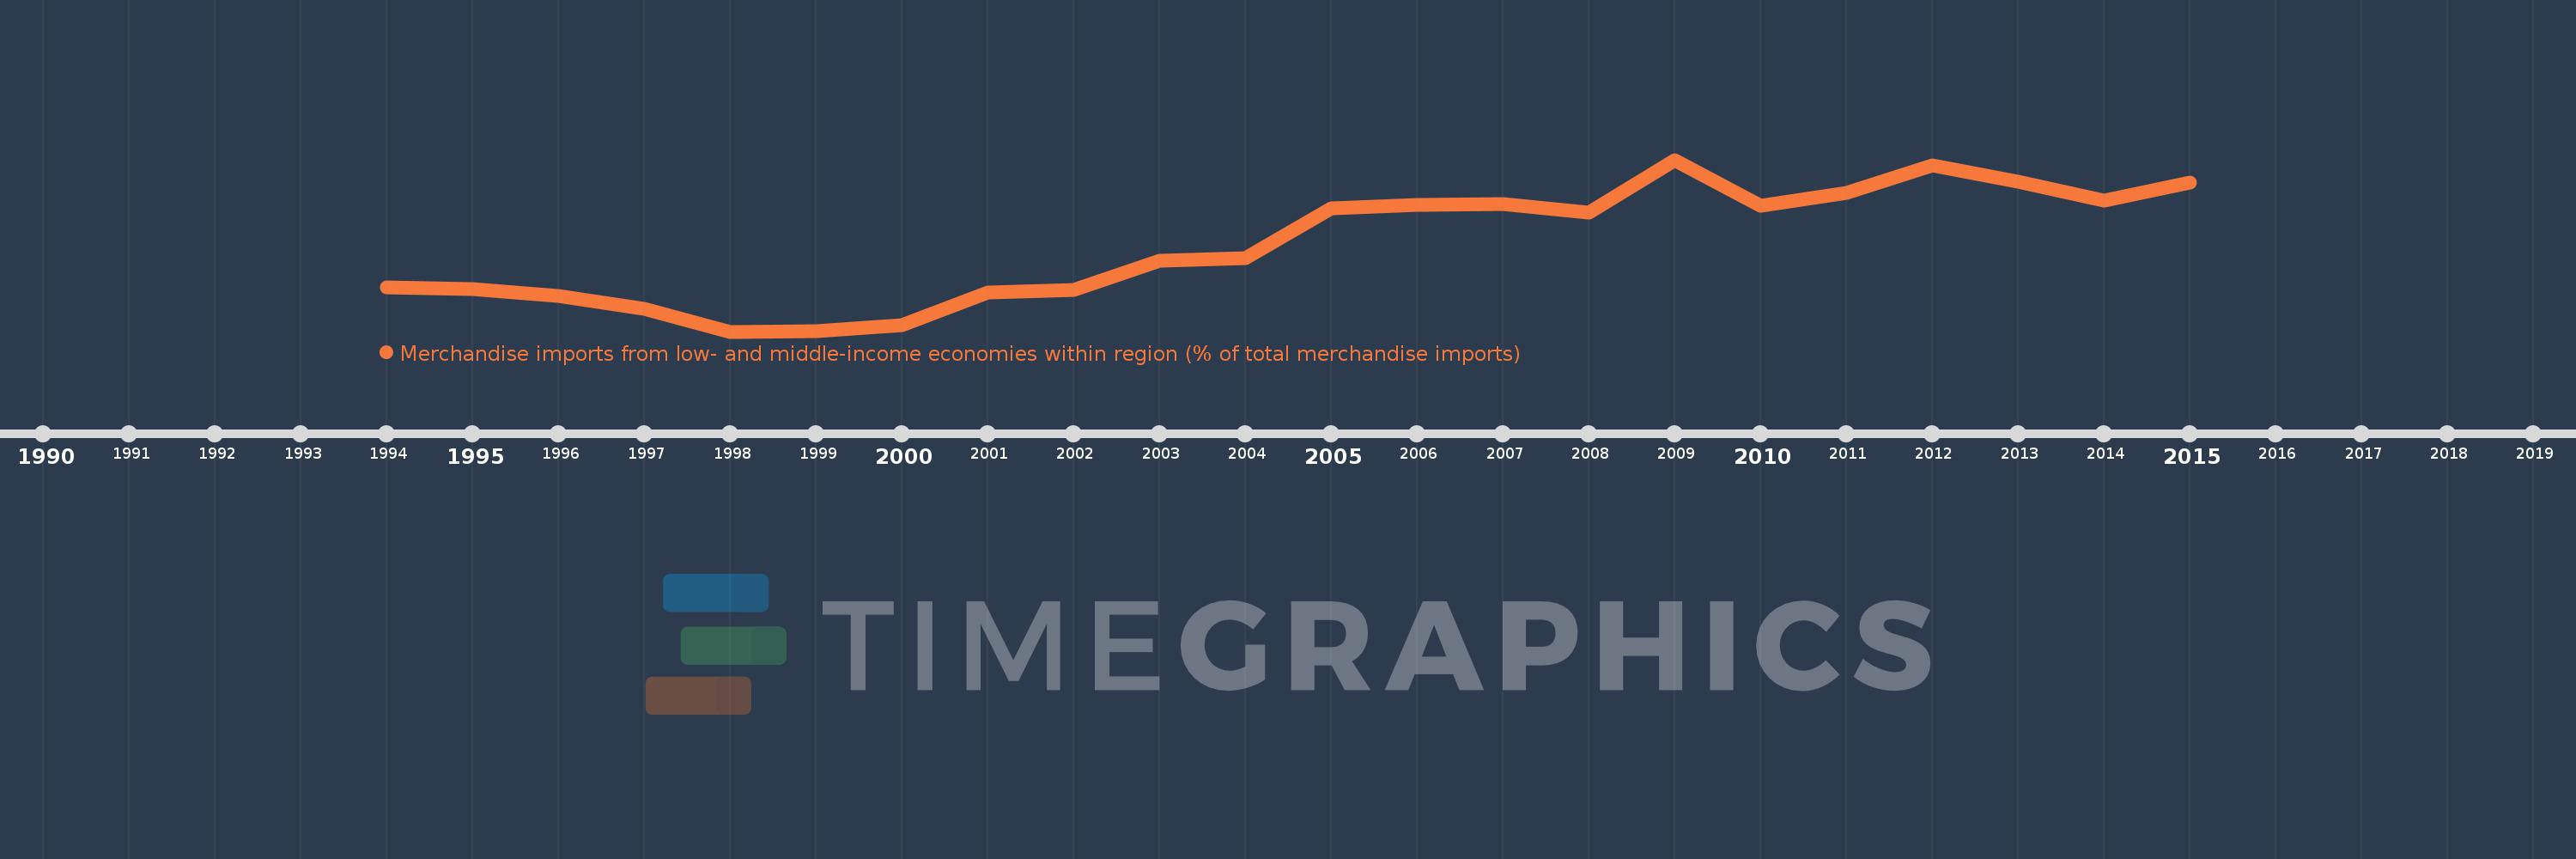
Merchandise imports from low- and middle-income economies within region (% of total merchandise imports)
2015,2014,2013,2012,2011,2010,2009,2008,2007,2006,2005,2004,2003,2002,2001,2000,1999,1998,1997,1996,1995,1994
This statistics in other country:
Timeline:
This timeline shows a graph from 1994 to 2015 of Romania. No data until 1993. Number of actual observations by date: 22.
Source name:
World Development Indicators
Source organization:
World Bank staff estimates based data from International Monetary Fund's Direction of Trade database.
Categories, topics:
Private Sector, Trade
Last updated:
apr 23, 2017
Indicators value changes by year
Maximum:
13.776
jan 1, 2009
At the date of observation
Value
Absolute change
Change from previous value
jan 1, 1994
7.529
+7.529
0.0%
jan 1, 1995
7.429
-0.1
-1.33%
jan 1, 1996
7.103
-0.326
-4.39%
jan 1, 1997
6.462
-0.641
-9.03%
jan 1, 1998
5.337
-1.125
-17.41%
jan 1, 1999
5.374
+0.037
0.7%
jan 1, 2000
5.652
+0.279
5.18%
jan 1, 2001
7.277
+1.625
28.74%
jan 1, 2002
7.387
+0.11
1.51%
jan 1, 2003
8.814
+1.427
19.32%
jan 1, 2004
8.948
+0.134
1.52%
jan 1, 2005
11.379
+2.431
27.17%
jan 1, 2006
11.544
+0.165
1.45%
jan 1, 2007
11.62
+0.076
0.66%
jan 1, 2008
11.165
-0.455
-3.91%
jan 1, 2009
13.776
+2.611
23.39%
jan 1, 2010
11.508
-2.268
-16.47%
jan 1, 2011
12.134
+0.626
5.44%
jan 1, 2012
13.505
+1.371
11.3%
jan 1, 2013
12.707
-0.797
-5.9%
jan 1, 2014
11.754
-0.953
-7.5%
jan 1, 2015
12.653
+0.898
7.64%
Ranking of countries by current statistics by years


Comments: