29
/
en
AIzaSyAYiBZKx7MnpbEhh9jyipgxe19OcubqV5w
April 1, 2024
28349
East Asia & Pacific (excluding high income)
EAP
false
2
1
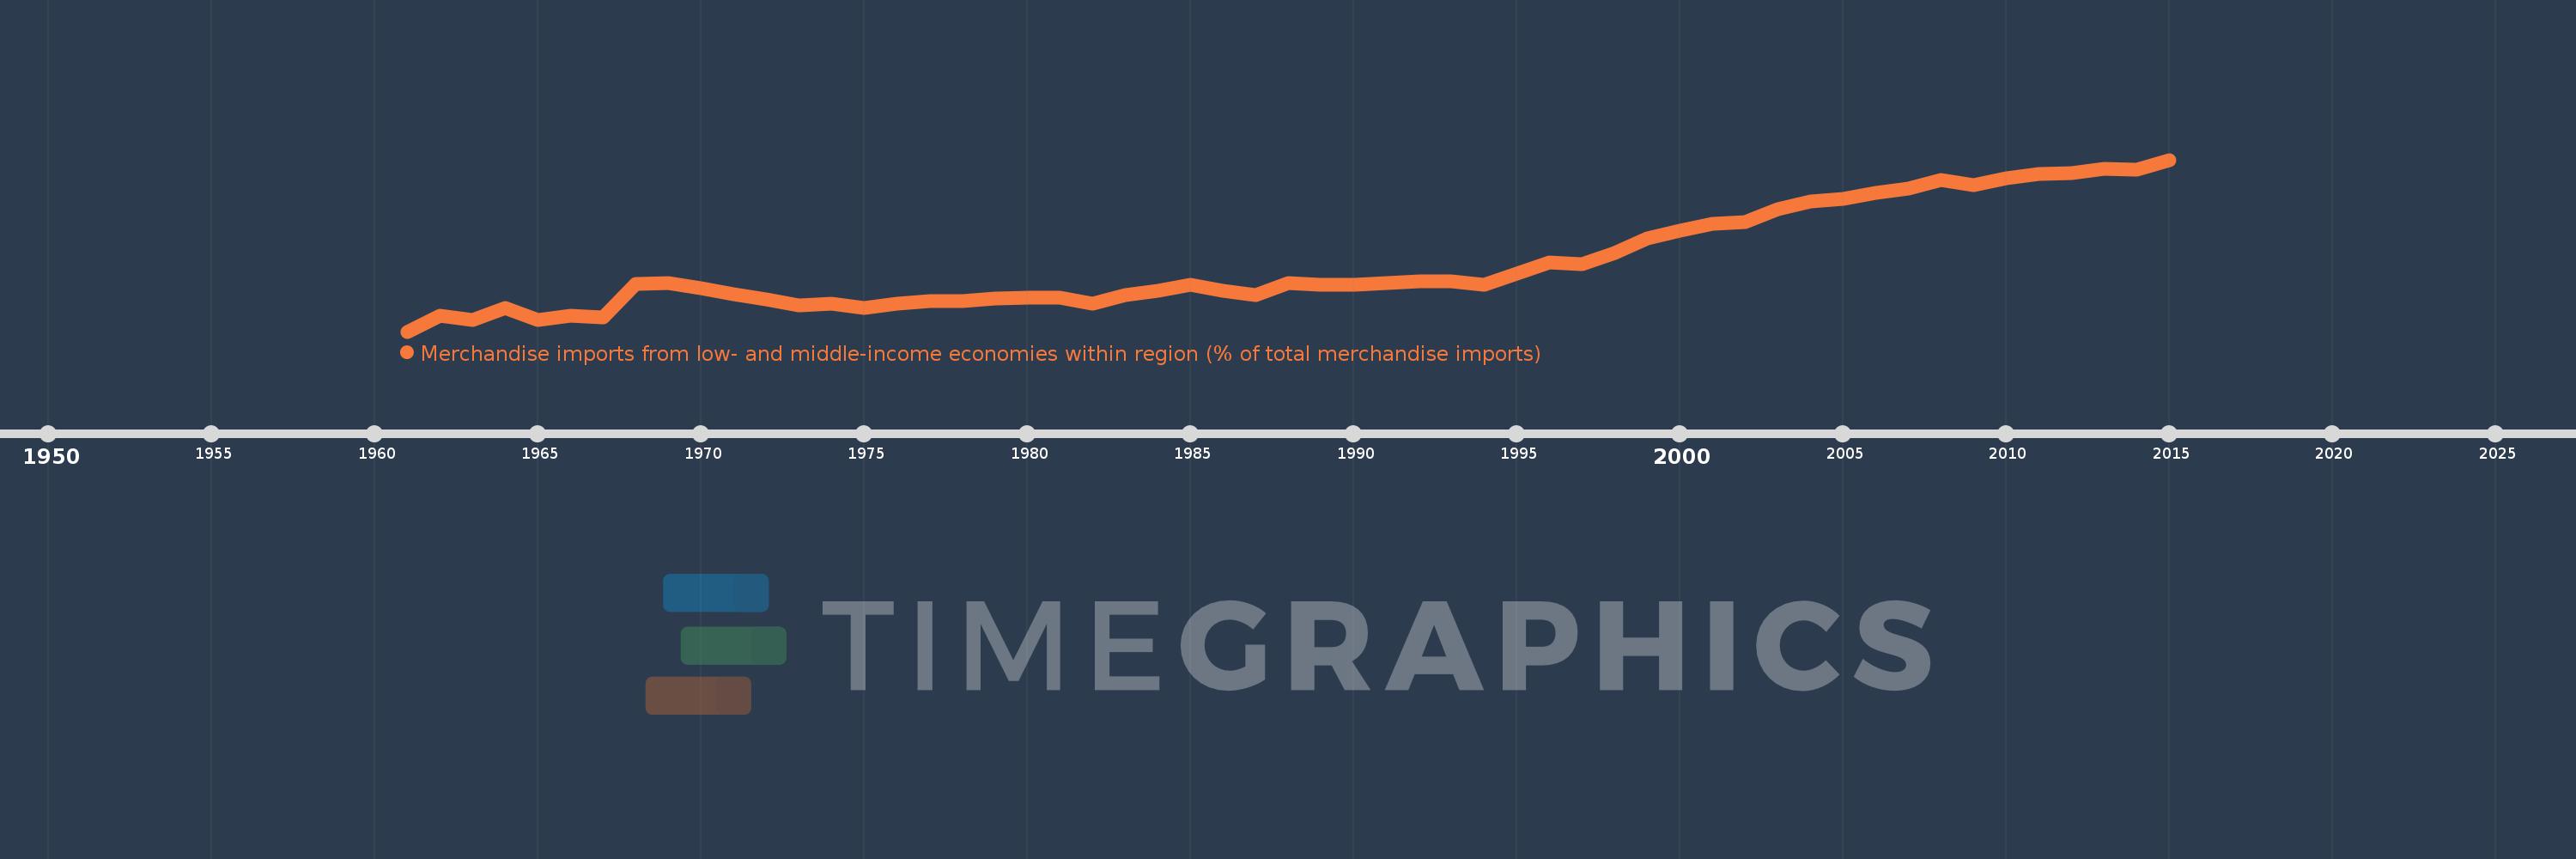
Merchandise imports from low- and middle-income economies within region (% of total merchandise imports)
2015,2014,2013,2012,2011,2010,2009,2008,2007,2006,2005,2004,2003,2002,2001,2000,1999,1998,1997,1996,1995,1994,1993,1992,1991,1990,1989,1988,1987,1986,1985,1984,1983,1982,1981,1980,1979,1978,1977,1976,1975,1974,1973,1972,1971,1970,1969,1968,1967,1966,1965,1964,1963,1962,1961
This statistics in other country:
Timeline:
This timeline shows a graph from 1961 to 2015 of East Asia & Pacific (excluding high income). No data until 1960. Number of actual observations by date: 55.
Source name:
World Development Indicators
Source organization:
World Bank staff estimates based data from International Monetary Fund's Direction of Trade database.
Categories, topics:
Private Sector, Trade
Last updated:
apr 23, 2017
Indicators value changes by year
Maximum:
17.615
jan 1, 2015
At the date of observation
Value
Absolute change
Change from previous value
jan 1, 1961
1.732
+1.732
0.0%
jan 1, 1962
3.22
+1.489
85.97%
jan 1, 1963
2.821
-0.399
-12.39%
jan 1, 1964
3.952
+1.131
40.1%
jan 1, 1965
2.789
-1.163
-29.44%
jan 1, 1966
3.201
+0.412
14.78%
jan 1, 1967
3.019
-0.182
-5.69%
jan 1, 1968
6.106
+3.087
102.25%
jan 1, 1969
6.257
+0.151
2.47%
jan 1, 1970
5.718
-0.539
-8.62%
jan 1, 1971
5.186
-0.531
-9.29%
jan 1, 1972
4.741
-0.445
-8.58%
jan 1, 1973
4.158
-0.583
-12.29%
jan 1, 1974
4.315
+0.156
3.75%
jan 1, 1975
3.905
-0.41
-9.49%
jan 1, 1976
4.327
+0.422
10.8%
jan 1, 1977
4.559
+0.232
5.36%
jan 1, 1978
4.582
+0.024
0.52%
jan 1, 1979
4.759
+0.176
3.85%
jan 1, 1980
4.897
+0.139
2.91%
jan 1, 1981
4.838
-0.06
-1.22%
jan 1, 1982
4.299
-0.539
-11.14%
jan 1, 1983
5.079
+0.78
18.15%
jan 1, 1984
5.52
+0.441
8.67%
jan 1, 1985
6.09
+0.571
10.34%
jan 1, 1986
5.509
-0.582
-9.55%
jan 1, 1987
5.094
-0.414
-7.52%
jan 1, 1988
6.219
+1.125
22.08%
jan 1, 1989
6.08
-0.139
-2.24%
jan 1, 1990
6.058
-0.021
-0.35%
jan 1, 1991
6.203
+0.144
2.38%
jan 1, 1992
6.393
+0.191
3.07%
jan 1, 1993
6.395
+0.002
0.03%
jan 1, 1994
6.051
-0.344
-5.38%
jan 1, 1995
7.059
+1.008
16.65%
jan 1, 1996
8.156
+1.097
15.53%
jan 1, 1997
7.999
-0.157
-1.92%
jan 1, 1998
9.033
+1.035
12.93%
jan 1, 1999
10.317
+1.283
14.21%
jan 1, 2000
11.043
+0.726
7.04%
jan 1, 2001
11.668
+0.624
5.65%
jan 1, 2002
11.83
+0.162
1.39%
jan 1, 2003
13.077
+1.247
10.54%
jan 1, 2004
13.786
+0.708
5.42%
jan 1, 2005
13.967
+0.181
1.32%
jan 1, 2006
14.593
+0.626
4.48%
jan 1, 2007
14.99
+0.397
2.72%
jan 1, 2008
15.711
+0.721
4.81%
jan 1, 2009
15.271
-0.441
-2.8%
jan 1, 2010
15.933
+0.662
4.34%
jan 1, 2011
16.309
+0.376
2.36%
jan 1, 2012
16.36
+0.051
0.31%
jan 1, 2013
16.75
+0.39
2.39%
jan 1, 2014
16.673
-0.077
-0.46%
jan 1, 2015
17.615
+0.942
5.65%
Ranking of countries by current statistics by years


Comments: