29
/
en
AIzaSyAYiBZKx7MnpbEhh9jyipgxe19OcubqV5w
April 1, 2024
32834
Europe & Central Asia (IDA & IBRD countries)
TEC
false
2
1
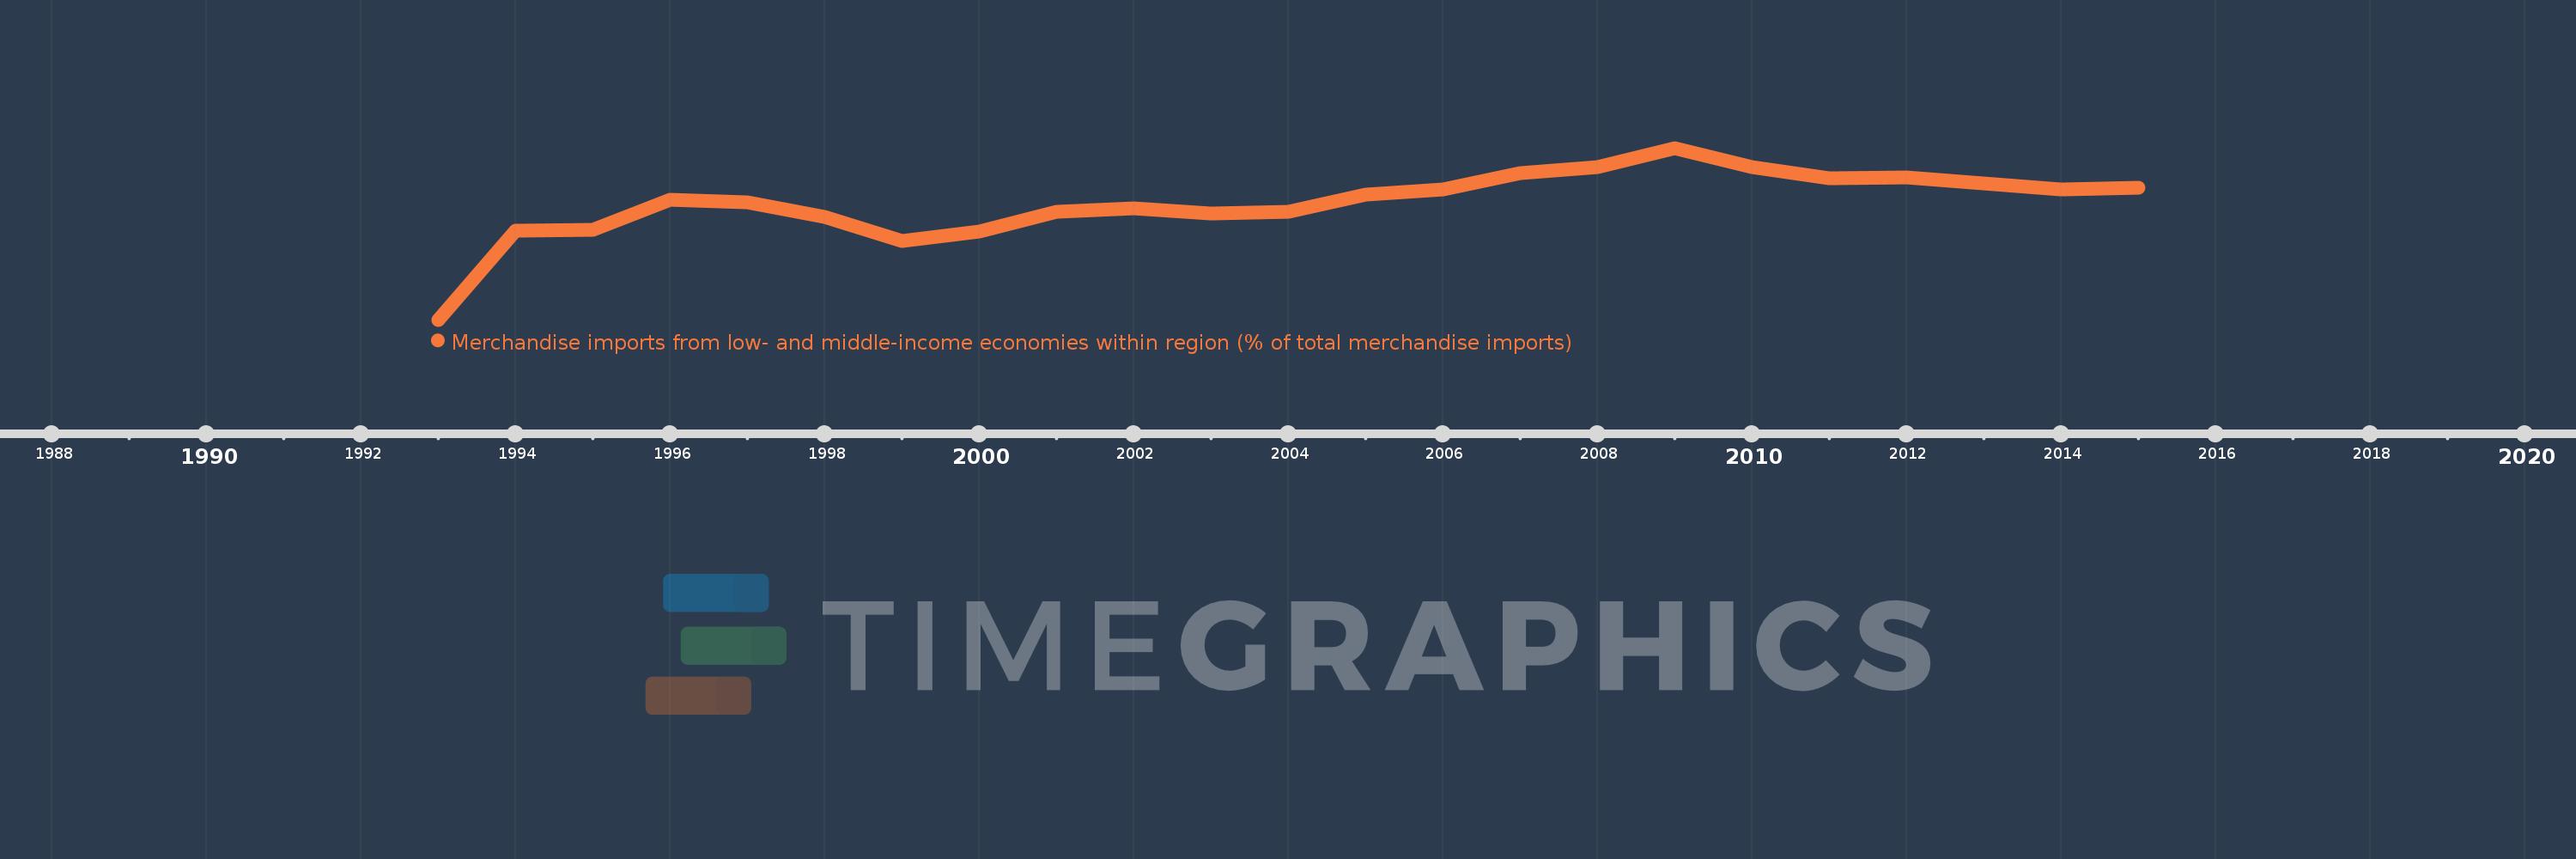
Merchandise imports from low- and middle-income economies within region (% of total merchandise imports)
2015,2014,2013,2012,2011,2010,2009,2008,2007,2006,2005,2004,2003,2002,2001,2000,1999,1998,1997,1996,1995,1994,1993
This statistics in other country:
Timeline:
This timeline shows a graph from 1993 to 2015 of Europe & Central Asia (IDA & IBRD countries). No data until 1992. Number of actual observations by date: 23.
Source name:
World Development Indicators
Source organization:
World Bank staff estimates based data from International Monetary Fund's Direction of Trade database.
Categories, topics:
Private Sector, Trade
Last updated:
apr 23, 2017
Indicators value changes by year
At the date of observation
Value
Absolute change
Change from previous value
jan 1, 1993
1.872
+1.872
0.0%
jan 1, 1994
4.909
+3.037
162.27%
jan 1, 1995
4.952
+0.043
0.88%
jan 1, 1996
5.976
+1.024
20.69%
jan 1, 1997
5.896
-0.081
-1.35%
jan 1, 1998
5.384
-0.512
-8.68%
jan 1, 1999
4.58
-0.804
-14.93%
jan 1, 2000
4.901
+0.321
7.0%
jan 1, 2001
5.578
+0.677
13.82%
jan 1, 2002
5.674
+0.096
1.72%
jan 1, 2003
5.501
-0.173
-3.05%
jan 1, 2004
5.577
+0.076
1.38%
jan 1, 2005
6.161
+0.584
10.47%
jan 1, 2006
6.328
+0.167
2.71%
jan 1, 2007
6.894
+0.566
8.94%
jan 1, 2008
7.098
+0.204
2.97%
jan 1, 2009
7.75
+0.651
9.18%
jan 1, 2010
7.096
-0.653
-8.43%
jan 1, 2011
6.713
-0.384
-5.41%
jan 1, 2012
6.74
+0.028
0.41%
jan 1, 2013
6.55
-0.19
-2.83%
jan 1, 2014
6.328
-0.222
-3.38%
jan 1, 2015
6.394
+0.066
1.04%
Ranking of countries by current statistics by years


Comments: