29
/
en
AIzaSyAYiBZKx7MnpbEhh9jyipgxe19OcubqV5w
April 1, 2024
266008
Tonga
TON
true
2
1
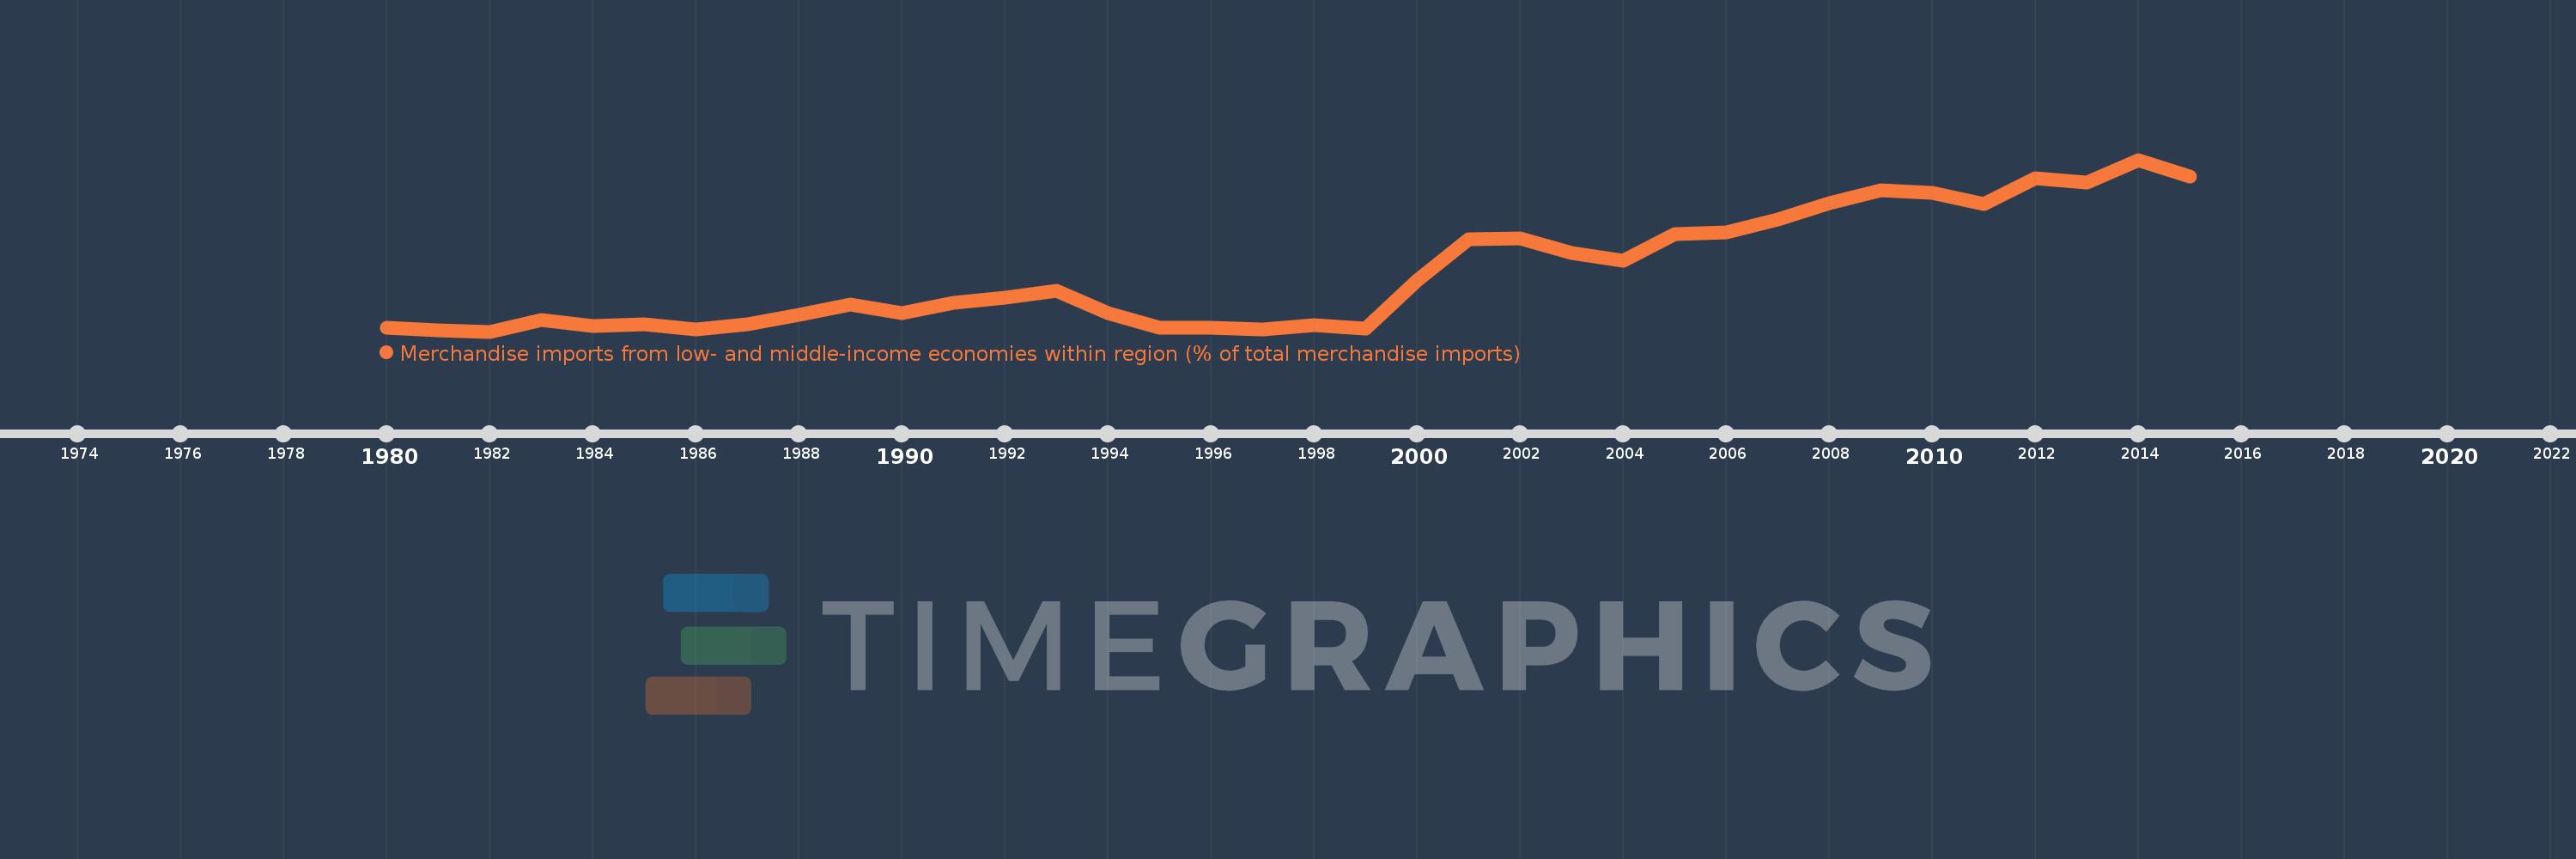
Merchandise imports from low- and middle-income economies within region (% of total merchandise imports)
2015,2014,2013,2012,2011,2010,2009,2008,2007,2006,2005,2004,2003,2002,2001,2000,1999,1998,1997,1996,1995,1994,1993,1992,1991,1990,1989,1988,1987,1986,1985,1984,1983,1982,1981,1980
This statistics in other country:
Timeline:
This timeline shows a graph from 1980 to 2015 of Tonga. No data until 1979. Number of actual observations by date: 36.
Source name:
World Development Indicators
Source organization:
World Bank staff estimates based data from International Monetary Fund's Direction of Trade database.
Categories, topics:
Private Sector, Trade
Last updated:
apr 23, 2017
Indicators value changes by year
Maximum:
56.546
jan 1, 2014
At the date of observation
Value
Absolute change
Change from previous value
jan 1, 1980
7.737
+7.737
0.0%
jan 1, 1981
6.904
-0.833
-10.77%
jan 1, 1982
6.53
-0.374
-5.42%
jan 1, 1983
9.804
+3.274
50.14%
jan 1, 1984
8.235
-1.568
-16.0%
jan 1, 1985
8.58
+0.345
4.18%
jan 1, 1986
7.104
-1.476
-17.2%
jan 1, 1987
8.591
+1.487
20.93%
jan 1, 1988
11.286
+2.695
31.37%
jan 1, 1989
14.482
+3.196
28.32%
jan 1, 1990
11.941
-2.541
-17.54%
jan 1, 1991
14.792
+2.851
23.88%
jan 1, 1992
16.372
+1.58
10.68%
jan 1, 1993
18.378
+2.005
12.25%
jan 1, 1994
11.845
-6.533
-35.55%
jan 1, 1995
7.671
-4.174
-35.24%
jan 1, 1996
7.532
-0.138
-1.8%
jan 1, 1997
7.079
-0.453
-6.02%
jan 1, 1998
8.367
+1.288
18.2%
jan 1, 1999
7.42
-0.947
-11.32%
jan 1, 2000
21.498
+14.079
189.74%
jan 1, 2001
33.3
+11.801
54.89%
jan 1, 2002
33.655
+0.356
1.07%
jan 1, 2003
29.484
-4.171
-12.39%
jan 1, 2004
27.203
-2.281
-7.74%
jan 1, 2005
35.028
+7.825
28.76%
jan 1, 2006
35.351
+0.324
0.92%
jan 1, 2007
39.21
+3.858
10.91%
jan 1, 2008
43.951
+4.741
12.09%
jan 1, 2009
47.569
+3.617
8.23%
jan 1, 2010
46.952
-0.617
-1.3%
jan 1, 2011
43.791
-3.161
-6.73%
jan 1, 2012
51.099
+7.309
16.69%
jan 1, 2013
49.943
-1.156
-2.26%
jan 1, 2014
56.546
+6.603
13.22%
jan 1, 2015
51.674
-4.872
-8.62%
Ranking of countries by current statistics by years


Comments: