29
/
en
AIzaSyAYiBZKx7MnpbEhh9jyipgxe19OcubqV5w
April 1, 2024
42633
Latin America & Caribbean (excluding high income)
LAC
false
2
1
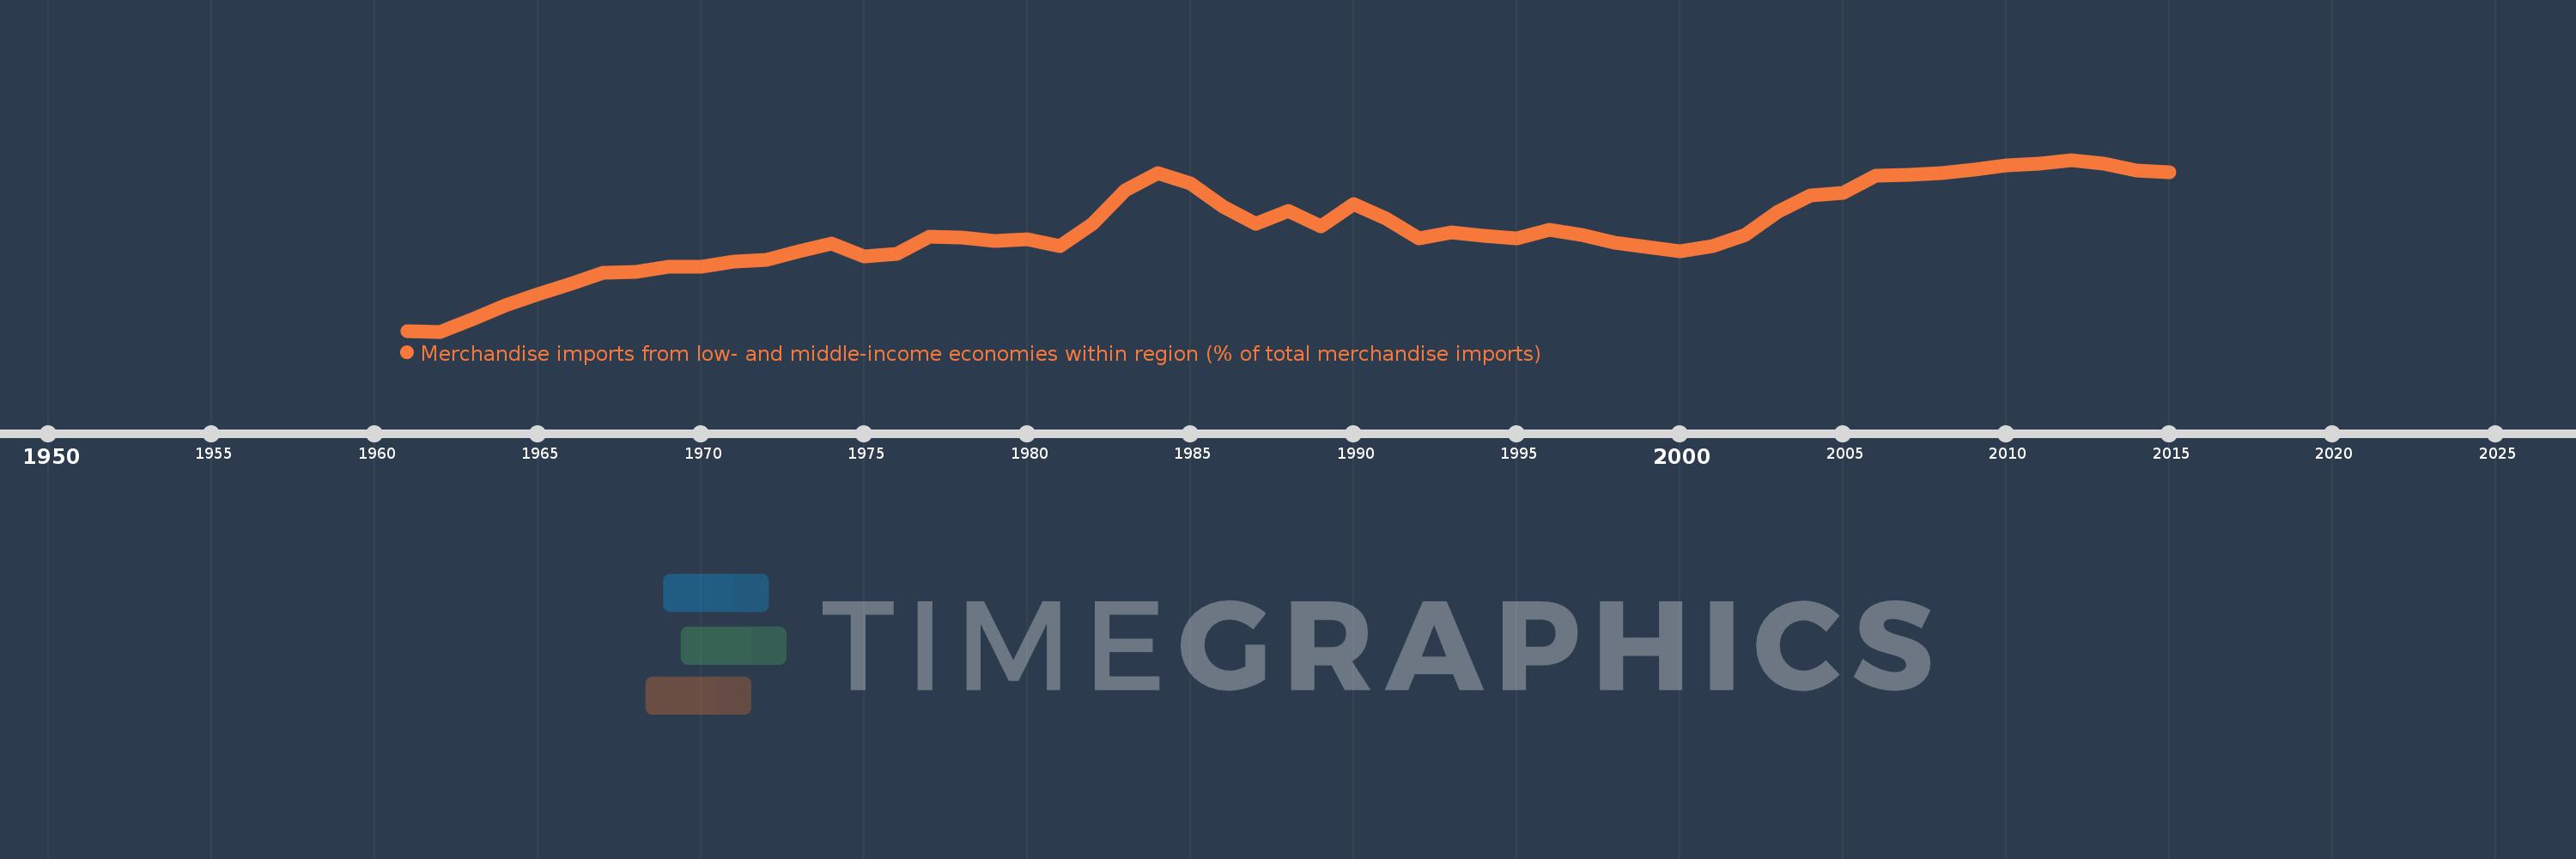
Merchandise imports from low- and middle-income economies within region (% of total merchandise imports)
2015,2014,2013,2012,2011,2010,2009,2008,2007,2006,2005,2004,2003,2002,2001,2000,1999,1998,1997,1996,1995,1994,1993,1992,1991,1990,1989,1988,1987,1986,1985,1984,1983,1982,1981,1980,1979,1978,1977,1976,1975,1974,1973,1972,1971,1970,1969,1968,1967,1966,1965,1964,1963,1962,1961
This statistics in other country:
Timeline:
This timeline shows a graph from 1961 to 2015 of Latin America & Caribbean (excluding high income). No data until 1960. Number of actual observations by date: 55.
Source name:
World Development Indicators
Source organization:
World Bank staff estimates based data from International Monetary Fund's Direction of Trade database.
Categories, topics:
Private Sector, Trade
Last updated:
apr 23, 2017
Indicators value changes by year
At the date of observation
Value
Absolute change
Change from previous value
jan 1, 1961
1.596
+1.596
0.0%
jan 1, 1962
1.564
-0.031
-1.97%
jan 1, 1963
2.089
+0.525
33.58%
jan 1, 1964
2.664
+0.575
27.51%
jan 1, 1965
3.125
+0.461
17.29%
jan 1, 1966
3.546
+0.421
13.47%
jan 1, 1967
4.011
+0.465
13.11%
jan 1, 1968
4.076
+0.065
1.62%
jan 1, 1969
4.275
+0.199
4.88%
jan 1, 1970
4.264
-0.01
-0.24%
jan 1, 1971
4.503
+0.238
5.59%
jan 1, 1972
4.577
+0.074
1.65%
jan 1, 1973
4.936
+0.359
7.84%
jan 1, 1974
5.256
+0.321
6.49%
jan 1, 1975
4.702
-0.554
-10.54%
jan 1, 1976
4.812
+0.11
2.33%
jan 1, 1977
5.543
+0.731
15.19%
jan 1, 1978
5.485
-0.058
-1.05%
jan 1, 1979
5.348
-0.137
-2.5%
jan 1, 1980
5.437
+0.089
1.67%
jan 1, 1981
5.137
-0.3
-5.52%
jan 1, 1982
6.079
+0.942
18.33%
jan 1, 1983
7.464
+1.385
22.78%
jan 1, 1984
8.202
+0.738
9.89%
jan 1, 1985
7.77
-0.432
-5.27%
jan 1, 1986
6.797
-0.973
-12.52%
jan 1, 1987
6.093
-0.704
-10.35%
jan 1, 1988
6.62
+0.526
8.64%
jan 1, 1989
5.962
-0.658
-9.94%
jan 1, 1990
6.904
+0.942
15.81%
jan 1, 1991
6.276
-0.629
-9.11%
jan 1, 1992
5.45
-0.825
-13.15%
jan 1, 1993
5.712
+0.262
4.8%
jan 1, 1994
5.584
-0.128
-2.24%
jan 1, 1995
5.473
-0.111
-1.99%
jan 1, 1996
5.831
+0.358
6.54%
jan 1, 1997
5.604
-0.227
-3.89%
jan 1, 1998
5.279
-0.325
-5.79%
jan 1, 1999
5.102
-0.177
-3.35%
jan 1, 2000
4.942
-0.16
-3.13%
jan 1, 2001
5.128
+0.185
3.75%
jan 1, 2002
5.611
+0.483
9.42%
jan 1, 2003
6.57
+0.959
17.09%
jan 1, 2004
7.271
+0.701
10.67%
jan 1, 2005
7.369
+0.098
1.35%
jan 1, 2006
8.094
+0.725
9.84%
jan 1, 2007
8.118
+0.024
0.3%
jan 1, 2008
8.191
+0.073
0.89%
jan 1, 2009
8.342
+0.152
1.85%
jan 1, 2010
8.509
+0.167
2.0%
jan 1, 2011
8.596
+0.087
1.02%
jan 1, 2012
8.754
+0.158
1.84%
jan 1, 2013
8.594
-0.16
-1.83%
jan 1, 2014
8.299
-0.294
-3.43%
jan 1, 2015
8.25
-0.049
-0.59%
Ranking of countries by current statistics by years


Comments: