29
/
en
AIzaSyAYiBZKx7MnpbEhh9jyipgxe19OcubqV5w
April 1, 2024
44448
Least developed countries: UN classification
LDC
false
2
1
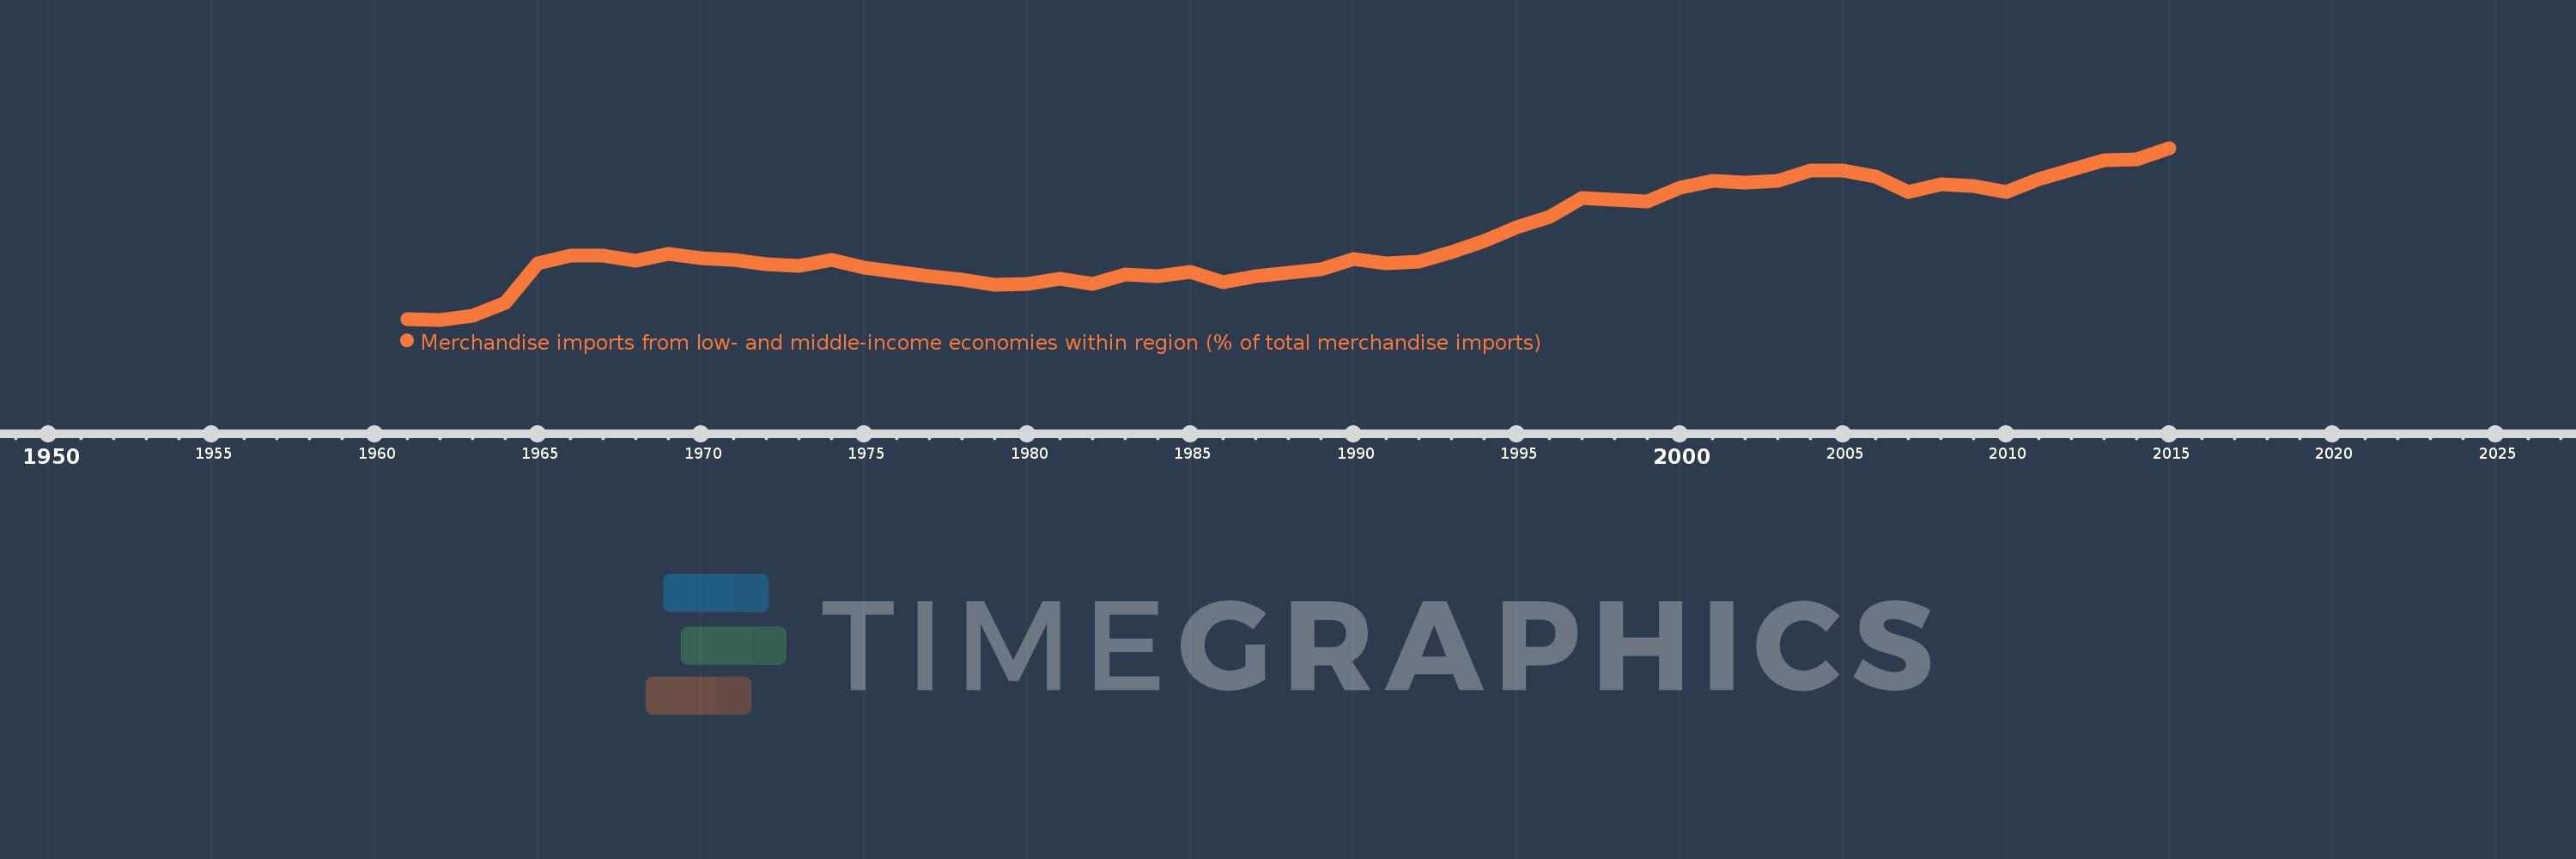
Merchandise imports from low- and middle-income economies within region (% of total merchandise imports)
2015,2014,2013,2012,2011,2010,2009,2008,2007,2006,2005,2004,2003,2002,2001,2000,1999,1998,1997,1996,1995,1994,1993,1992,1991,1990,1989,1988,1987,1986,1985,1984,1983,1982,1981,1980,1979,1978,1977,1976,1975,1974,1973,1972,1971,1970,1969,1968,1967,1966,1965,1964,1963,1962,1961
This statistics in other country:
Timeline:
This timeline shows a graph from 1961 to 2015 of Least developed countries: UN classification. No data until 1960. Number of actual observations by date: 55.
Source name:
World Development Indicators
Source organization:
World Bank staff estimates based data from International Monetary Fund's Direction of Trade database.
Categories, topics:
Private Sector, Trade
Last updated:
apr 23, 2017
Indicators value changes by year
Maximum:
24.995
jan 1, 2015
At the date of observation
Value
Absolute change
Change from previous value
jan 1, 1961
2.899
+2.899
0.0%
jan 1, 1962
2.864
-0.034
-1.18%
jan 1, 1963
3.39
+0.526
18.37%
jan 1, 1964
5.005
+1.615
47.63%
jan 1, 1965
10.177
+5.172
103.33%
jan 1, 1966
11.077
+0.899
8.83%
jan 1, 1967
11.083
+0.007
0.06%
jan 1, 1968
10.421
-0.663
-5.98%
jan 1, 1969
11.335
+0.915
8.78%
jan 1, 1970
10.776
-0.559
-4.93%
jan 1, 1971
10.537
-0.239
-2.22%
jan 1, 1972
9.983
-0.554
-5.26%
jan 1, 1973
9.828
-0.155
-1.55%
jan 1, 1974
10.588
+0.76
7.73%
jan 1, 1975
9.54
-1.048
-9.9%
jan 1, 1976
9.014
-0.526
-5.51%
jan 1, 1977
8.436
-0.579
-6.42%
jan 1, 1978
8.03
-0.406
-4.81%
jan 1, 1979
7.399
-0.631
-7.86%
jan 1, 1980
7.46
+0.061
0.82%
jan 1, 1981
8.161
+0.701
9.4%
jan 1, 1982
7.497
-0.664
-8.13%
jan 1, 1983
8.671
+1.174
15.66%
jan 1, 1984
8.5
-0.17
-1.97%
jan 1, 1985
9.012
+0.512
6.02%
jan 1, 1986
7.731
-1.281
-14.21%
jan 1, 1987
8.437
+0.706
9.13%
jan 1, 1988
8.932
+0.495
5.86%
jan 1, 1989
9.325
+0.393
4.4%
jan 1, 1990
10.726
+1.401
15.02%
jan 1, 1991
10.099
-0.627
-5.84%
jan 1, 1992
10.368
+0.27
2.67%
jan 1, 1993
11.627
+1.258
12.14%
jan 1, 1994
12.97
+1.344
11.56%
jan 1, 1995
14.765
+1.794
13.84%
jan 1, 1996
16.127
+1.362
9.23%
jan 1, 1997
18.562
+2.435
15.1%
jan 1, 1998
18.34
-0.222
-1.2%
jan 1, 1999
18.055
-0.286
-1.56%
jan 1, 2000
19.894
+1.84
10.19%
jan 1, 2001
20.786
+0.892
4.48%
jan 1, 2002
20.493
-0.293
-1.41%
jan 1, 2003
20.763
+0.27
1.32%
jan 1, 2004
22.072
+1.309
6.31%
jan 1, 2005
22.101
+0.029
0.13%
jan 1, 2006
21.275
-0.826
-3.74%
jan 1, 2007
19.334
-1.941
-9.12%
jan 1, 2008
20.292
+0.958
4.96%
jan 1, 2009
20.083
-0.209
-1.03%
jan 1, 2010
19.363
-0.721
-3.59%
jan 1, 2011
20.974
+1.611
8.32%
jan 1, 2012
22.246
+1.272
6.06%
jan 1, 2013
23.375
+1.13
5.08%
jan 1, 2014
23.504
+0.129
0.55%
jan 1, 2015
24.995
+1.491
6.34%
Ranking of countries by current statistics by years


Comments: