29
/
en
AIzaSyAYiBZKx7MnpbEhh9jyipgxe19OcubqV5w
April 1, 2024
52397
OECD members
OED
false
2
1
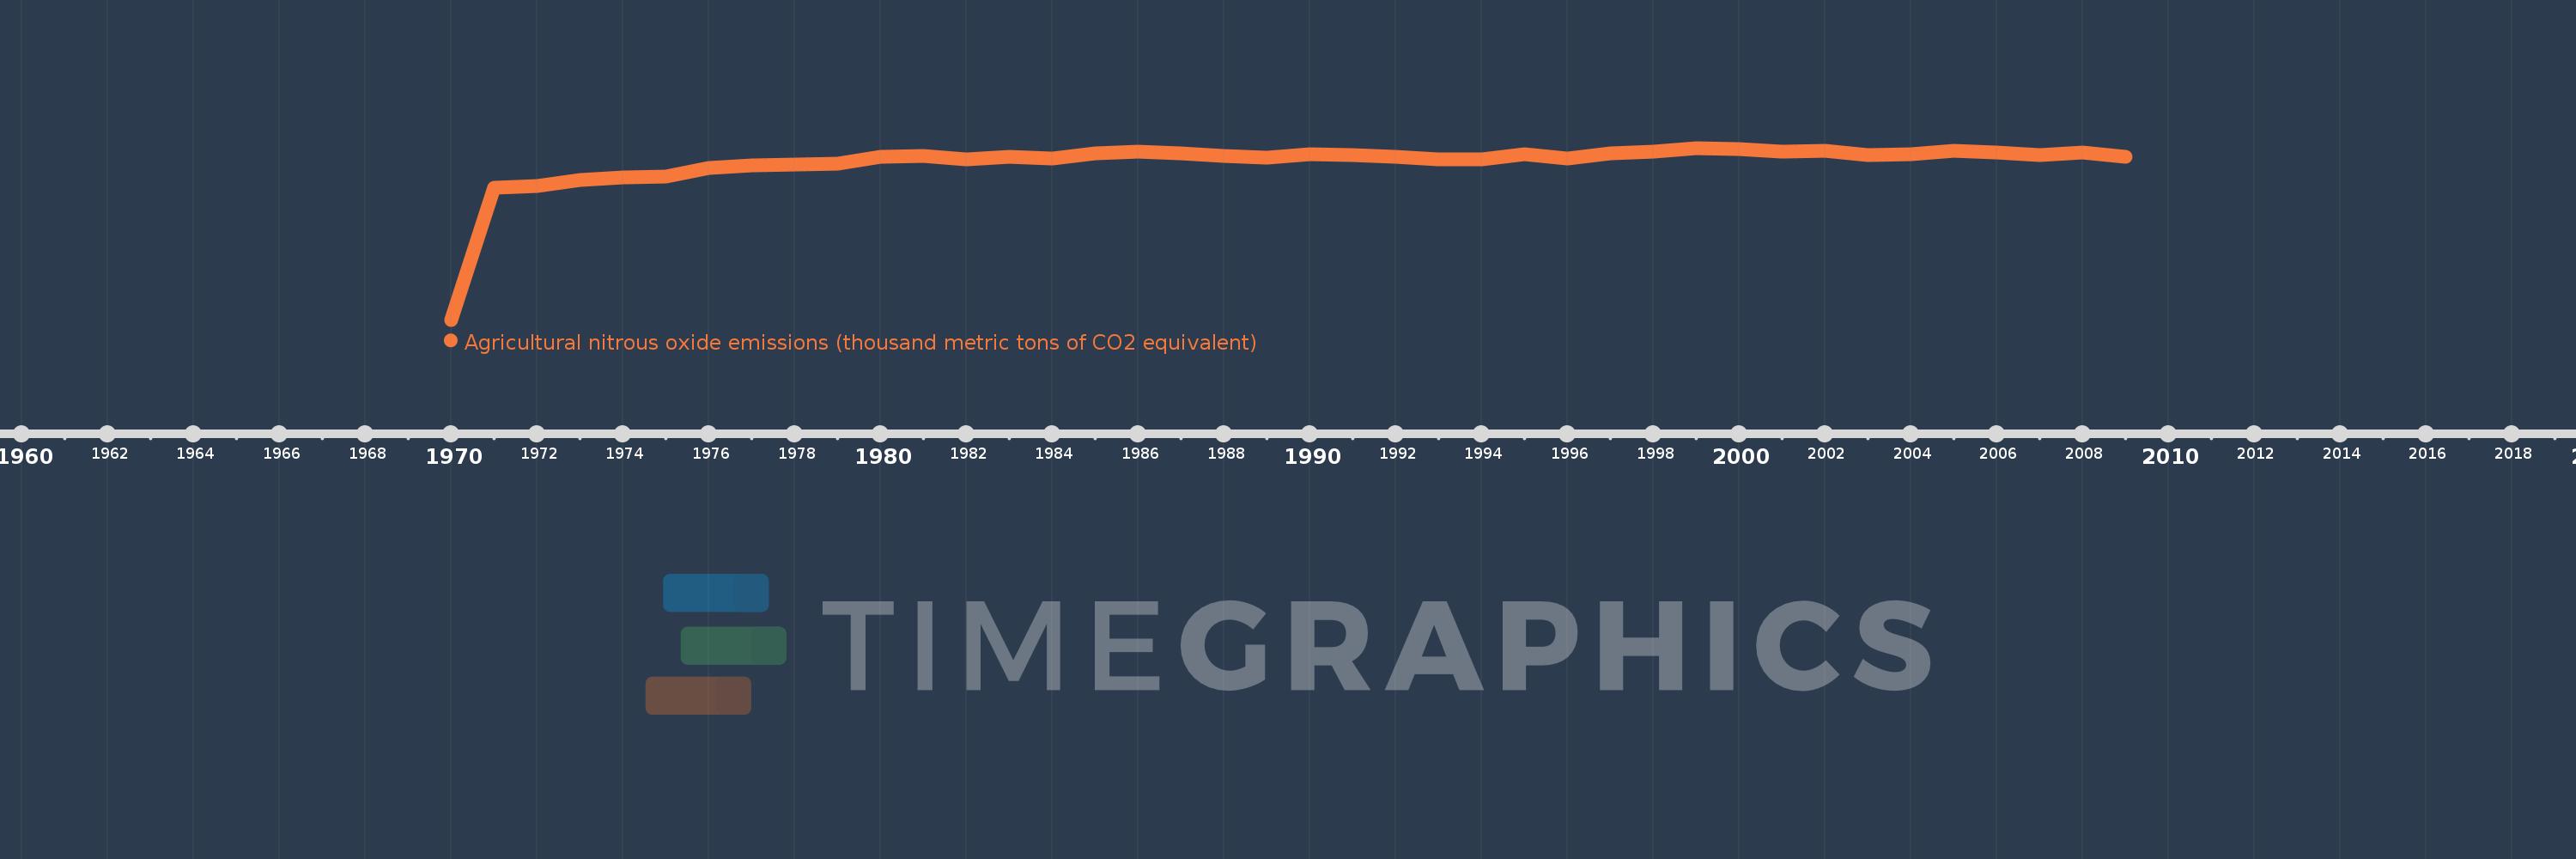
Agricultural nitrous oxide emissions (thousand metric tons of CO2 equivalent)
2009,2008,2007,2006,2005,2004,2003,2002,2001,2000,1999,1998,1997,1996,1995,1994,1993,1992,1991,1990,1989,1988,1987,1986,1985,1984,1983,1982,1981,1980,1979,1978,1977,1976,1975,1974,1973,1972,1971,1970
This statistics in other country:
AfghanistanAlbaniaAlgeriaAmerican SamoaAndorraAngolaAntigua and BarbudaArab WorldArgentinaArmeniaArubaAustraliaAustriaAzerbaijanBahamas, TheBahrainBangladeshBarbadosBelarusBelgiumBelizeBeninBermudaBhutanBoliviaBosnia and HerzegovinaBotswanaBrazilBritish Virgin IslandsBrunei DarussalamBulgariaBurkina FasoBurundiCabo VerdeCambodiaCameroonCanadaCaribbean small statesCayman IslandsCentral African RepublicCentral Europe and the BalticsChadChannel IslandsChileChinaColombiaComorosCongo, Dem. Rep.Congo, Rep.Costa RicaCote d'IvoireCroatiaCubaCuracaoCyprusCzech RepublicDenmarkDjiboutiDominicaDominican RepublicEarly-demographic dividendEast Asia & PacificEast Asia & Pacific (excluding high income)East Asia & Pacific (IDA & IBRD countries)EcuadorEgypt, Arab Rep.El SalvadorEquatorial GuineaEritreaEstoniaEthiopiaEuro areaEurope & Central AsiaEurope & Central Asia (excluding high income)Europe & Central Asia (IDA & IBRD countries)European UnionFaroe IslandsFijiFinlandFragile and conflict affected situationsFranceFrench PolynesiaGabonGambia, TheGeorgiaGermanyGhanaGibraltarGreeceGreenlandGrenadaGuamGuatemalaGuineaGuinea-BissauGuyanaHaitiHeavily indebted poor countries (HIPC)High incomeHondurasHong Kong SAR, ChinaHungaryIBRD onlyIcelandIDA & IBRD totalIDA blendIDA onlyIDA totalIndiaIndonesiaIran, Islamic Rep.IraqIrelandIsle of ManIsraelItalyJamaicaJapanJordanKazakhstanKenyaKiribatiKorea, Dem. People’s Rep.Korea, Rep.KosovoKuwaitKyrgyz RepublicLao PDRLate-demographic dividendLatin America & Caribbean Latin America & Caribbean (excluding high income)Latin America & the Caribbean (IDA & IBRD countries)LatviaLeast developed countries: UN classificationLebanonLesothoLiberiaLibyaLiechtensteinLithuaniaLow & middle incomeLow incomeLower middle incomeLuxembourgMacao SAR, ChinaMacedonia, FYRMadagascarMalawiMalaysiaMaldivesMaliMaltaMarshall IslandsMauritaniaMauritiusMexicoMicronesia, Fed. Sts.Middle East & North AfricaMiddle East & North Africa (excluding high income)Middle East & North Africa (IDA & IBRD countries)Middle incomeMoldovaMonacoMongoliaMontenegroMoroccoMozambiqueMyanmarNamibiaNauruNepalNetherlandsNew CaledoniaNew ZealandNicaraguaNigerNigeriaNorth AmericaNorthern Mariana IslandsNorwayOECD membersOmanOther small statesPacific island small statesPakistanPalauPanamaPapua New GuineaParaguayPeruPhilippinesPolandPortugalPost-demographic dividendPre-demographic dividendPuerto RicoQatarRomaniaRussian FederationRwandaSamoaSan MarinoSao Tome and PrincipeSaudi ArabiaSenegalSerbiaSeychellesSierra LeoneSingaporeSint Maarten (Dutch part)Slovak RepublicSloveniaSmall statesSolomon IslandsSomaliaSouth AfricaSouth AsiaSouth Asia (IDA & IBRD)South SudanSpainSri LankaSt. Kitts and NevisSt. LuciaSt. Martin (French part)St. Vincent and the GrenadinesSub-Saharan Africa Sub-Saharan Africa (excluding high income)Sub-Saharan Africa (IDA & IBRD countries)SudanSurinameSwazilandSwedenSwitzerlandSyrian Arab RepublicTajikistanTanzaniaThailandTimor-LesteTogoTongaTrinidad and TobagoTunisiaTurkeyTurkmenistanTurks and Caicos IslandsTuvaluUgandaUkraineUnited Arab EmiratesUnited KingdomUnited StatesUpper middle incomeUruguayUzbekistanVanuatuVenezuela, RBVietnamVirgin Islands (U.S.)West Bank and GazaWorldYemen, Rep.ZambiaZimbabwe Timeline:
This timeline shows a graph from 1970 to 2009 of OECD members. No data until 1969. Number of actual observations by date: 40.
Source name:
World Development Indicators
Source organization:
European Commission, Joint Research Centre (JRC)/Netherlands Environmental Assessment Agency (PBL). Emission Database for Global Atmospheric Research (EDGAR): http://edgar.jrc.ec.europa.eu/
Categories, topics:
Agriculture & Rural Development, Environment
Last updated:
apr 23, 2017
Indicators value changes by year
Maximum:
529.74K
jan 1, 1999
At the date of observation
Value
Absolute change
Change from previous value
jan 1, 1971
405.945K
+405.945K
%
jan 1, 1972
412.107K
+6.162K
1.52%
jan 1, 1973
430.491K
+18.385K
4.46%
jan 1, 1974
440.029K
+9.538K
2.22%
jan 1, 1975
441.024K
+994.829
0.23%
jan 1, 1976
467.325K
+26.301K
5.96%
jan 1, 1977
475.738K
+8.412K
1.8%
jan 1, 1978
477.923K
+2.185K
0.46%
jan 1, 1979
481.606K
+3.683K
0.77%
jan 1, 1980
501.921K
+20.315K
4.22%
jan 1, 1981
504.399K
+2.479K
0.49%
jan 1, 1982
494.822K
-9.578K
-1.9%
jan 1, 1983
502.092K
+7.27K
1.47%
jan 1, 1984
496.235K
-5.857K
-1.17%
jan 1, 1985
512.103K
+15.868K
3.2%
jan 1, 1986
517.797K
+5.693K
1.11%
jan 1, 1987
513.417K
-4.379K
-0.85%
jan 1, 1988
505.799K
-7.619K
-1.48%
jan 1, 1989
499.333K
-6.465K
-1.28%
jan 1, 1990
511.06K
+11.727K
2.35%
jan 1, 1991
508.601K
-2.46K
-0.48%
jan 1, 1992
502.447K
-6.153K
-1.21%
jan 1, 1993
494.278K
-8.17K
-1.63%
jan 1, 1994
493.493K
-784.234
-0.16%
jan 1, 1995
510.193K
+16.7K
3.38%
jan 1, 1996
497.385K
-12.809K
-2.51%
jan 1, 1997
512.179K
+14.794K
2.97%
jan 1, 1998
518.093K
+5.913K
1.15%
jan 1, 1999
529.74K
+11.648K
2.25%
jan 1, 2000
525.752K
-3.988K
-0.75%
jan 1, 2001
517.029K
-8.724K
-1.66%
jan 1, 2002
521.583K
+4.554K
0.88%
jan 1, 2003
507.12K
-14.463K
-2.77%
jan 1, 2004
509.592K
+2.472K
0.49%
jan 1, 2005
521.154K
+11.562K
2.27%
jan 1, 2006
514.607K
-6.547K
-1.26%
jan 1, 2007
506.553K
-8.054K
-1.57%
jan 1, 2008
515.557K
+9.004K
1.78%
jan 1, 2009
502.64K
-12.917K
-2.51%
Ranking of countries by current statistics by years


Comments: