29
/
en
AIzaSyAYiBZKx7MnpbEhh9jyipgxe19OcubqV5w
April 1, 2024
79189
Barbados
BRB
true
2
1
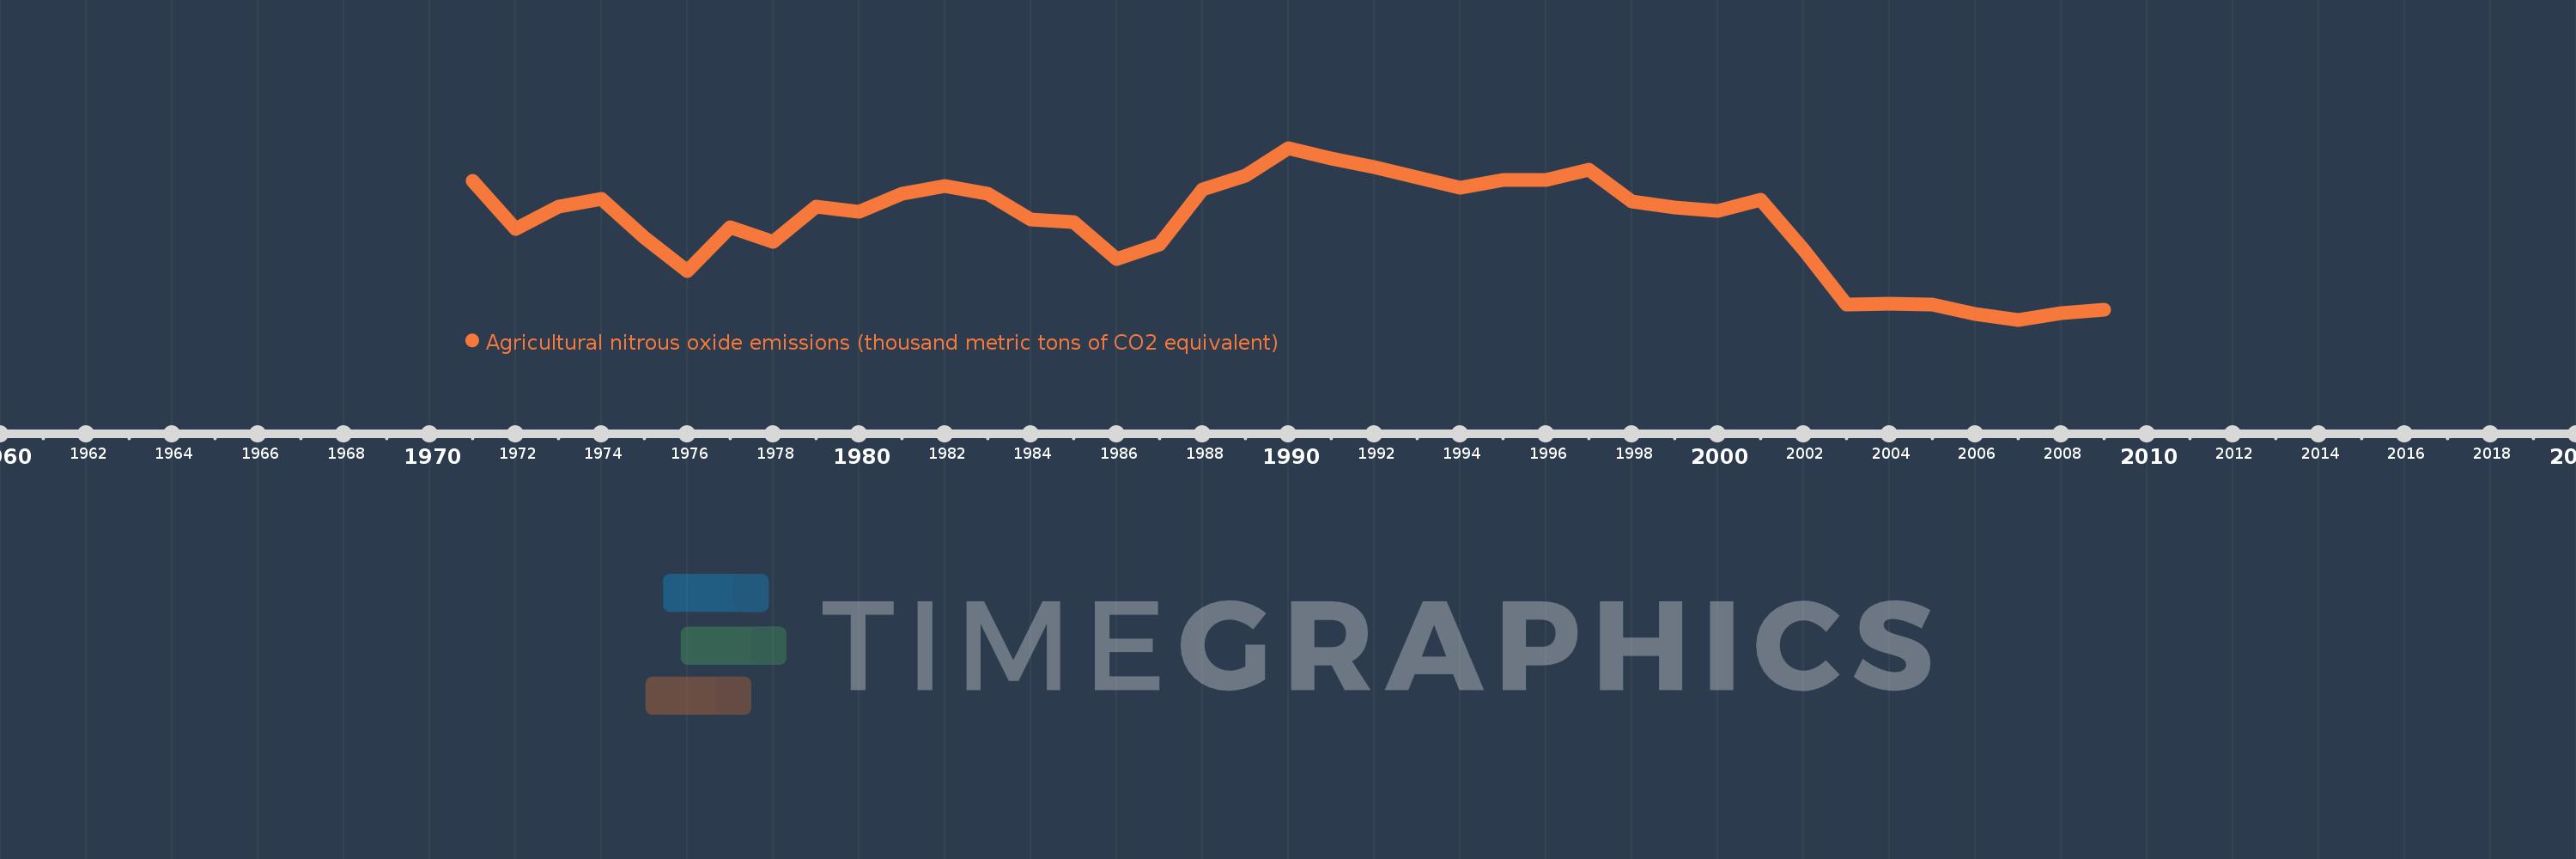
Agricultural nitrous oxide emissions (thousand metric tons of CO2 equivalent)
2009,2008,2007,2006,2005,2004,2003,2002,2001,2000,1999,1998,1997,1996,1995,1994,1993,1992,1991,1990,1989,1988,1987,1986,1985,1984,1983,1982,1981,1980,1979,1978,1977,1976,1975,1974,1973,1972,1971
This statistics in other country:
AfghanistanAlbaniaAlgeriaAmerican SamoaAndorraAngolaAntigua and BarbudaArab WorldArgentinaArmeniaArubaAustraliaAustriaAzerbaijanBahamas, TheBahrainBangladeshBarbadosBelarusBelgiumBelizeBeninBermudaBhutanBoliviaBosnia and HerzegovinaBotswanaBrazilBritish Virgin IslandsBrunei DarussalamBulgariaBurkina FasoBurundiCabo VerdeCambodiaCameroonCanadaCaribbean small statesCayman IslandsCentral African RepublicCentral Europe and the BalticsChadChannel IslandsChileChinaColombiaComorosCongo, Dem. Rep.Congo, Rep.Costa RicaCote d'IvoireCroatiaCubaCuracaoCyprusCzech RepublicDenmarkDjiboutiDominicaDominican RepublicEarly-demographic dividendEast Asia & PacificEast Asia & Pacific (excluding high income)East Asia & Pacific (IDA & IBRD countries)EcuadorEgypt, Arab Rep.El SalvadorEquatorial GuineaEritreaEstoniaEthiopiaEuro areaEurope & Central AsiaEurope & Central Asia (excluding high income)Europe & Central Asia (IDA & IBRD countries)European UnionFaroe IslandsFijiFinlandFragile and conflict affected situationsFranceFrench PolynesiaGabonGambia, TheGeorgiaGermanyGhanaGibraltarGreeceGreenlandGrenadaGuamGuatemalaGuineaGuinea-BissauGuyanaHaitiHeavily indebted poor countries (HIPC)High incomeHondurasHong Kong SAR, ChinaHungaryIBRD onlyIcelandIDA & IBRD totalIDA blendIDA onlyIDA totalIndiaIndonesiaIran, Islamic Rep.IraqIrelandIsle of ManIsraelItalyJamaicaJapanJordanKazakhstanKenyaKiribatiKorea, Dem. People’s Rep.Korea, Rep.KosovoKuwaitKyrgyz RepublicLao PDRLate-demographic dividendLatin America & Caribbean Latin America & Caribbean (excluding high income)Latin America & the Caribbean (IDA & IBRD countries)LatviaLeast developed countries: UN classificationLebanonLesothoLiberiaLibyaLiechtensteinLithuaniaLow & middle incomeLow incomeLower middle incomeLuxembourgMacao SAR, ChinaMacedonia, FYRMadagascarMalawiMalaysiaMaldivesMaliMaltaMarshall IslandsMauritaniaMauritiusMexicoMicronesia, Fed. Sts.Middle East & North AfricaMiddle East & North Africa (excluding high income)Middle East & North Africa (IDA & IBRD countries)Middle incomeMoldovaMonacoMongoliaMontenegroMoroccoMozambiqueMyanmarNamibiaNauruNepalNetherlandsNew CaledoniaNew ZealandNicaraguaNigerNigeriaNorth AmericaNorthern Mariana IslandsNorwayOECD membersOmanOther small statesPacific island small statesPakistanPalauPanamaPapua New GuineaParaguayPeruPhilippinesPolandPortugalPost-demographic dividendPre-demographic dividendPuerto RicoQatarRomaniaRussian FederationRwandaSamoaSan MarinoSao Tome and PrincipeSaudi ArabiaSenegalSerbiaSeychellesSierra LeoneSingaporeSint Maarten (Dutch part)Slovak RepublicSloveniaSmall statesSolomon IslandsSomaliaSouth AfricaSouth AsiaSouth Asia (IDA & IBRD)South SudanSpainSri LankaSt. Kitts and NevisSt. LuciaSt. Martin (French part)St. Vincent and the GrenadinesSub-Saharan Africa Sub-Saharan Africa (excluding high income)Sub-Saharan Africa (IDA & IBRD countries)SudanSurinameSwazilandSwedenSwitzerlandSyrian Arab RepublicTajikistanTanzaniaThailandTimor-LesteTogoTongaTrinidad and TobagoTunisiaTurkeyTurkmenistanTurks and Caicos IslandsTuvaluUgandaUkraineUnited Arab EmiratesUnited KingdomUnited StatesUpper middle incomeUruguayUzbekistanVanuatuVenezuela, RBVietnamVirgin Islands (U.S.)West Bank and GazaWorldYemen, Rep.ZambiaZimbabwe Timeline:
This timeline shows a graph from 1971 to 2009 of Barbados. No data until 1970. Number of actual observations by date: 39.
Source name:
World Development Indicators
Source organization:
European Commission, Joint Research Centre (JRC)/Netherlands Environmental Assessment Agency (PBL). Emission Database for Global Atmospheric Research (EDGAR): http://edgar.jrc.ec.europa.eu/
Categories, topics:
Agriculture & Rural Development, Environment
Last updated:
apr 23, 2017
Indicators value changes by year
Minimum:
23.573
jan 1, 2007
Maximum:
44.591
jan 1, 1990
At the date of observation
Value
Absolute change
Change from previous value
jan 1, 1971
40.546
+40.546
0.0%
jan 1, 1972
34.66
-5.886
-14.52%
jan 1, 1973
37.427
+2.767
7.98%
jan 1, 1974
38.319
+0.892
2.38%
jan 1, 1975
33.657
-4.662
-12.17%
jan 1, 1976
29.563
-4.093
-12.16%
jan 1, 1977
34.917
+5.354
18.11%
jan 1, 1978
33.136
-1.781
-5.1%
jan 1, 1979
37.43
+4.294
12.96%
jan 1, 1980
36.821
-0.609
-1.63%
jan 1, 1981
39.021
+2.199
5.97%
jan 1, 1982
39.89
+0.869
2.23%
jan 1, 1983
39.001
-0.889
-2.23%
jan 1, 1984
35.875
-3.126
-8.02%
jan 1, 1985
35.553
-0.322
-0.9%
jan 1, 1986
31.009
-4.544
-12.78%
jan 1, 1987
32.805
+1.796
5.79%
jan 1, 1988
39.562
+6.758
20.6%
jan 1, 1989
41.168
+1.605
4.06%
jan 1, 1990
44.591
+3.423
8.32%
jan 1, 1991
43.262
-1.329
-2.98%
jan 1, 1992
42.28
-0.982
-2.27%
jan 1, 1993
40.944
-1.336
-3.16%
jan 1, 1994
39.732
-1.212
-2.96%
jan 1, 1995
40.666
+0.934
2.35%
jan 1, 1996
40.721
+0.055
0.14%
jan 1, 1997
41.894
+1.173
2.88%
jan 1, 1998
38.068
-3.826
-9.13%
jan 1, 1999
37.348
-0.72
-1.89%
jan 1, 2000
36.908
-0.44
-1.18%
jan 1, 2001
38.231
+1.323
3.59%
jan 1, 2002
32.191
-6.041
-15.8%
jan 1, 2003
25.443
-6.747
-20.96%
jan 1, 2004
25.512
+0.069
0.27%
jan 1, 2005
25.431
-0.081
-0.32%
jan 1, 2006
24.279
-1.153
-4.53%
jan 1, 2007
23.573
-0.706
-2.91%
jan 1, 2008
24.336
+0.763
3.24%
jan 1, 2009
24.794
+0.458
1.88%
Ranking of countries by current statistics by years


Comments: