29
/
en
AIzaSyAYiBZKx7MnpbEhh9jyipgxe19OcubqV5w
April 1, 2024
120649
Dominica
DMA
true
2
1
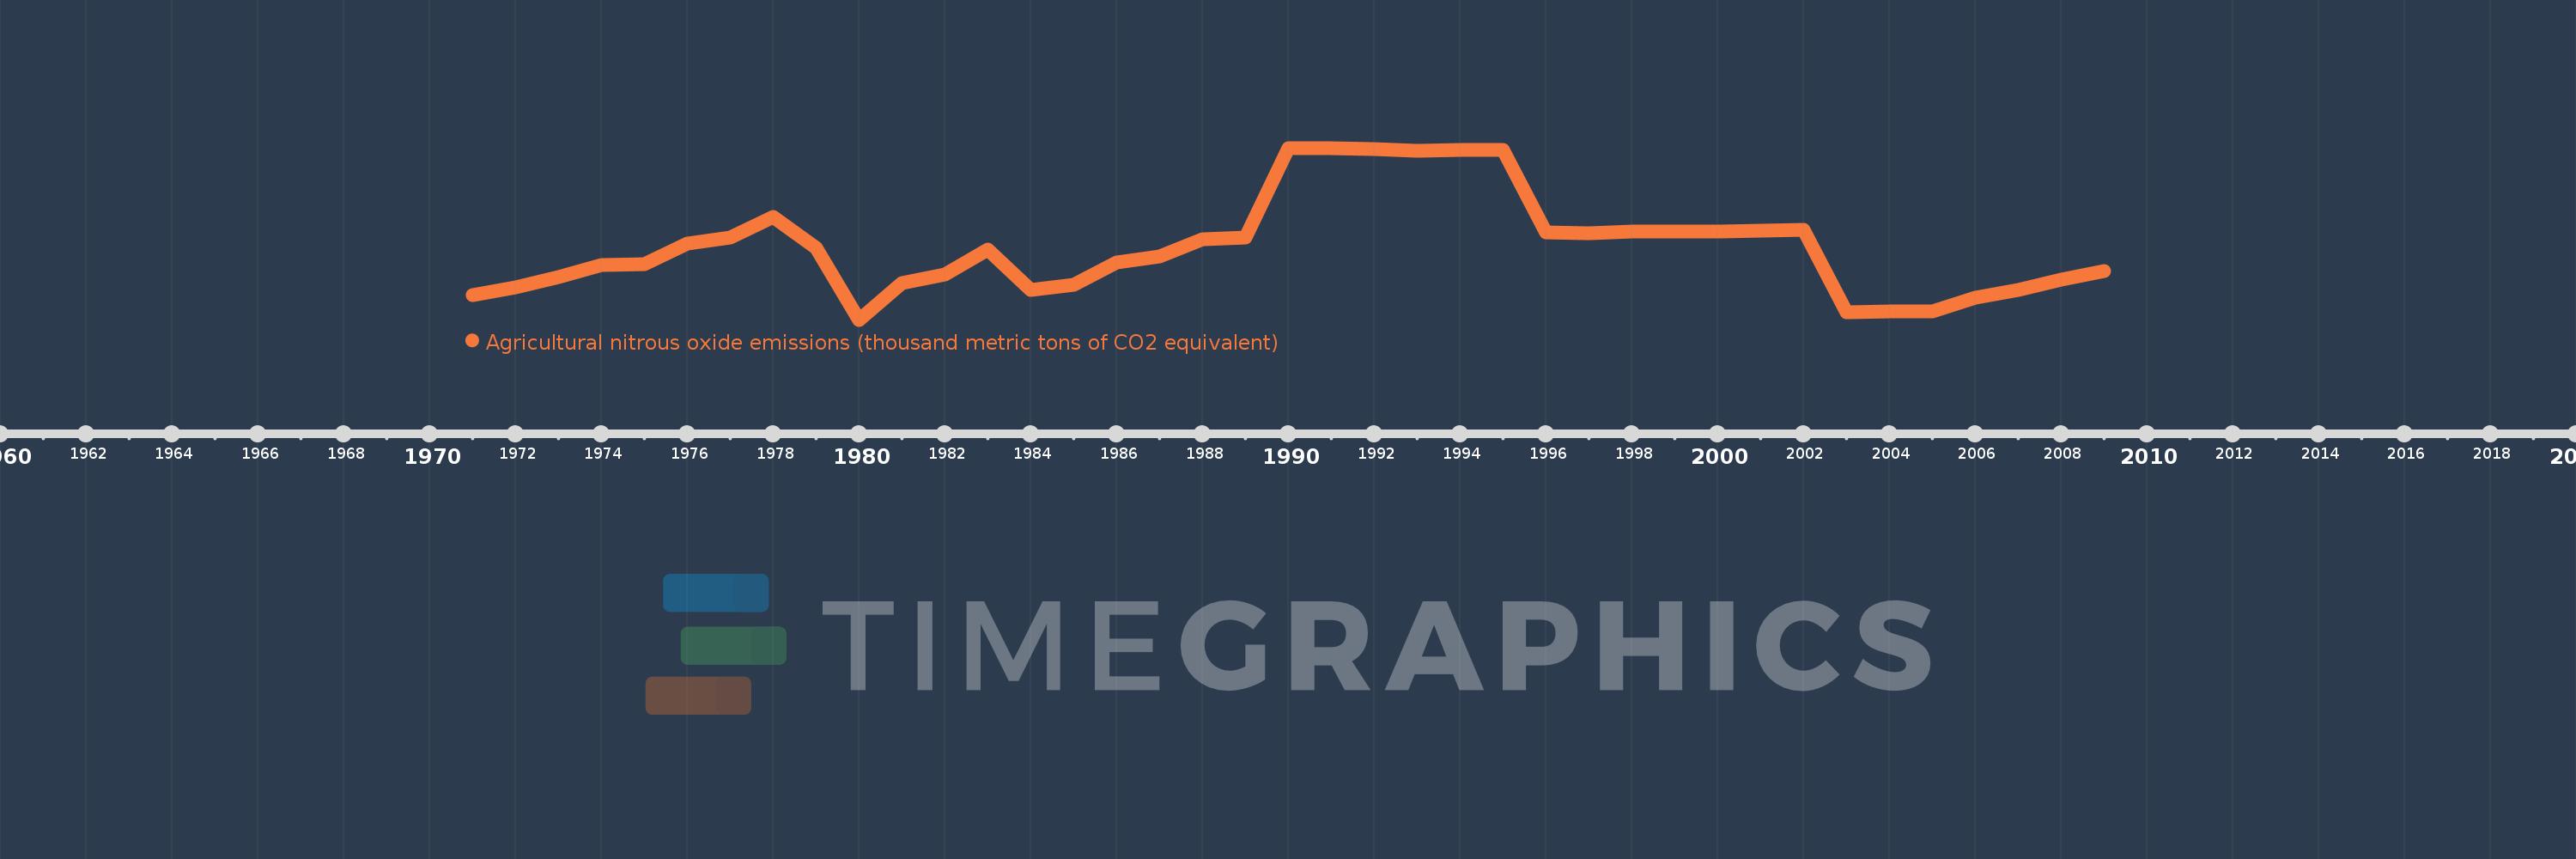
Agricultural nitrous oxide emissions (thousand metric tons of CO2 equivalent)
2009,2008,2007,2006,2005,2004,2003,2002,2001,2000,1999,1998,1997,1996,1995,1994,1993,1992,1991,1990,1989,1988,1987,1986,1985,1984,1983,1982,1981,1980,1979,1978,1977,1976,1975,1974,1973,1972,1971
This statistics in other country:
AfghanistanAlbaniaAlgeriaAmerican SamoaAndorraAngolaAntigua and BarbudaArab WorldArgentinaArmeniaArubaAustraliaAustriaAzerbaijanBahamas, TheBahrainBangladeshBarbadosBelarusBelgiumBelizeBeninBermudaBhutanBoliviaBosnia and HerzegovinaBotswanaBrazilBritish Virgin IslandsBrunei DarussalamBulgariaBurkina FasoBurundiCabo VerdeCambodiaCameroonCanadaCaribbean small statesCayman IslandsCentral African RepublicCentral Europe and the BalticsChadChannel IslandsChileChinaColombiaComorosCongo, Dem. Rep.Congo, Rep.Costa RicaCote d'IvoireCroatiaCubaCuracaoCyprusCzech RepublicDenmarkDjiboutiDominicaDominican RepublicEarly-demographic dividendEast Asia & PacificEast Asia & Pacific (excluding high income)East Asia & Pacific (IDA & IBRD countries)EcuadorEgypt, Arab Rep.El SalvadorEquatorial GuineaEritreaEstoniaEthiopiaEuro areaEurope & Central AsiaEurope & Central Asia (excluding high income)Europe & Central Asia (IDA & IBRD countries)European UnionFaroe IslandsFijiFinlandFragile and conflict affected situationsFranceFrench PolynesiaGabonGambia, TheGeorgiaGermanyGhanaGibraltarGreeceGreenlandGrenadaGuamGuatemalaGuineaGuinea-BissauGuyanaHaitiHeavily indebted poor countries (HIPC)High incomeHondurasHong Kong SAR, ChinaHungaryIBRD onlyIcelandIDA & IBRD totalIDA blendIDA onlyIDA totalIndiaIndonesiaIran, Islamic Rep.IraqIrelandIsle of ManIsraelItalyJamaicaJapanJordanKazakhstanKenyaKiribatiKorea, Dem. People’s Rep.Korea, Rep.KosovoKuwaitKyrgyz RepublicLao PDRLate-demographic dividendLatin America & Caribbean Latin America & Caribbean (excluding high income)Latin America & the Caribbean (IDA & IBRD countries)LatviaLeast developed countries: UN classificationLebanonLesothoLiberiaLibyaLiechtensteinLithuaniaLow & middle incomeLow incomeLower middle incomeLuxembourgMacao SAR, ChinaMacedonia, FYRMadagascarMalawiMalaysiaMaldivesMaliMaltaMarshall IslandsMauritaniaMauritiusMexicoMicronesia, Fed. Sts.Middle East & North AfricaMiddle East & North Africa (excluding high income)Middle East & North Africa (IDA & IBRD countries)Middle incomeMoldovaMonacoMongoliaMontenegroMoroccoMozambiqueMyanmarNamibiaNauruNepalNetherlandsNew CaledoniaNew ZealandNicaraguaNigerNigeriaNorth AmericaNorthern Mariana IslandsNorwayOECD membersOmanOther small statesPacific island small statesPakistanPalauPanamaPapua New GuineaParaguayPeruPhilippinesPolandPortugalPost-demographic dividendPre-demographic dividendPuerto RicoQatarRomaniaRussian FederationRwandaSamoaSan MarinoSao Tome and PrincipeSaudi ArabiaSenegalSerbiaSeychellesSierra LeoneSingaporeSint Maarten (Dutch part)Slovak RepublicSloveniaSmall statesSolomon IslandsSomaliaSouth AfricaSouth AsiaSouth Asia (IDA & IBRD)South SudanSpainSri LankaSt. Kitts and NevisSt. LuciaSt. Martin (French part)St. Vincent and the GrenadinesSub-Saharan Africa Sub-Saharan Africa (excluding high income)Sub-Saharan Africa (IDA & IBRD countries)SudanSurinameSwazilandSwedenSwitzerlandSyrian Arab RepublicTajikistanTanzaniaThailandTimor-LesteTogoTongaTrinidad and TobagoTunisiaTurkeyTurkmenistanTurks and Caicos IslandsTuvaluUgandaUkraineUnited Arab EmiratesUnited KingdomUnited StatesUpper middle incomeUruguayUzbekistanVanuatuVenezuela, RBVietnamVirgin Islands (U.S.)West Bank and GazaWorldYemen, Rep.ZambiaZimbabwe Timeline:
This timeline shows a graph from 1971 to 2009 of Dominica. No data until 1970. Number of actual observations by date: 39.
Source name:
World Development Indicators
Source organization:
European Commission, Joint Research Centre (JRC)/Netherlands Environmental Assessment Agency (PBL). Emission Database for Global Atmospheric Research (EDGAR): http://edgar.jrc.ec.europa.eu/
Categories, topics:
Agriculture & Rural Development, Environment
Last updated:
apr 23, 2017
Indicators value changes by year
Maximum:
21.499
jan 1, 1990
At the date of observation
Value
Absolute change
Change from previous value
jan 1, 1971
10.358
+10.358
0.0%
jan 1, 1972
11.003
+0.645
6.22%
jan 1, 1973
11.781
+0.778
7.07%
jan 1, 1974
12.683
+0.902
7.65%
jan 1, 1975
12.694
+0.012
0.09%
jan 1, 1976
14.293
+1.598
12.59%
jan 1, 1977
14.739
+0.446
3.12%
jan 1, 1978
16.277
+1.538
10.43%
jan 1, 1979
13.964
-2.313
-14.21%
jan 1, 1980
8.526
-5.438
-38.94%
jan 1, 1981
11.279
+2.753
32.3%
jan 1, 1982
11.975
+0.696
6.17%
jan 1, 1983
13.802
+1.827
15.26%
jan 1, 1984
10.766
-3.036
-22.0%
jan 1, 1985
11.141
+0.375
3.48%
jan 1, 1986
12.822
+1.682
15.09%
jan 1, 1987
13.333
+0.511
3.99%
jan 1, 1988
14.596
+1.263
9.47%
jan 1, 1989
14.719
+0.123
0.84%
jan 1, 1990
21.499
+6.78
46.06%
jan 1, 1991
21.473
-0.026
-0.12%
jan 1, 1992
21.445
-0.028
-0.13%
jan 1, 1993
21.259
-0.186
-0.87%
jan 1, 1994
21.336
+0.076
0.36%
jan 1, 1995
21.344
+0.008
0.04%
jan 1, 1996
15.145
-6.199
-29.04%
jan 1, 1997
15.064
-0.081
-0.53%
jan 1, 1998
15.178
+0.114
0.76%
jan 1, 1999
15.214
+0.036
0.24%
jan 1, 2000
15.217
+0.003
0.02%
jan 1, 2001
15.271
+0.054
0.35%
jan 1, 2002
15.286
+0.015
0.1%
jan 1, 2003
9.101
-6.185
-40.46%
jan 1, 2004
9.154
+0.053
0.58%
jan 1, 2005
9.169
+0.016
0.17%
jan 1, 2006
10.214
+1.045
11.4%
jan 1, 2007
10.749
+0.535
5.23%
jan 1, 2008
11.541
+0.792
7.37%
jan 1, 2009
12.203
+0.662
5.73%
Ranking of countries by current statistics by years


Comments: