29
/
en
AIzaSyAYiBZKx7MnpbEhh9jyipgxe19OcubqV5w
April 1, 2024
263202
Timor-Leste
TLS
true
2
1
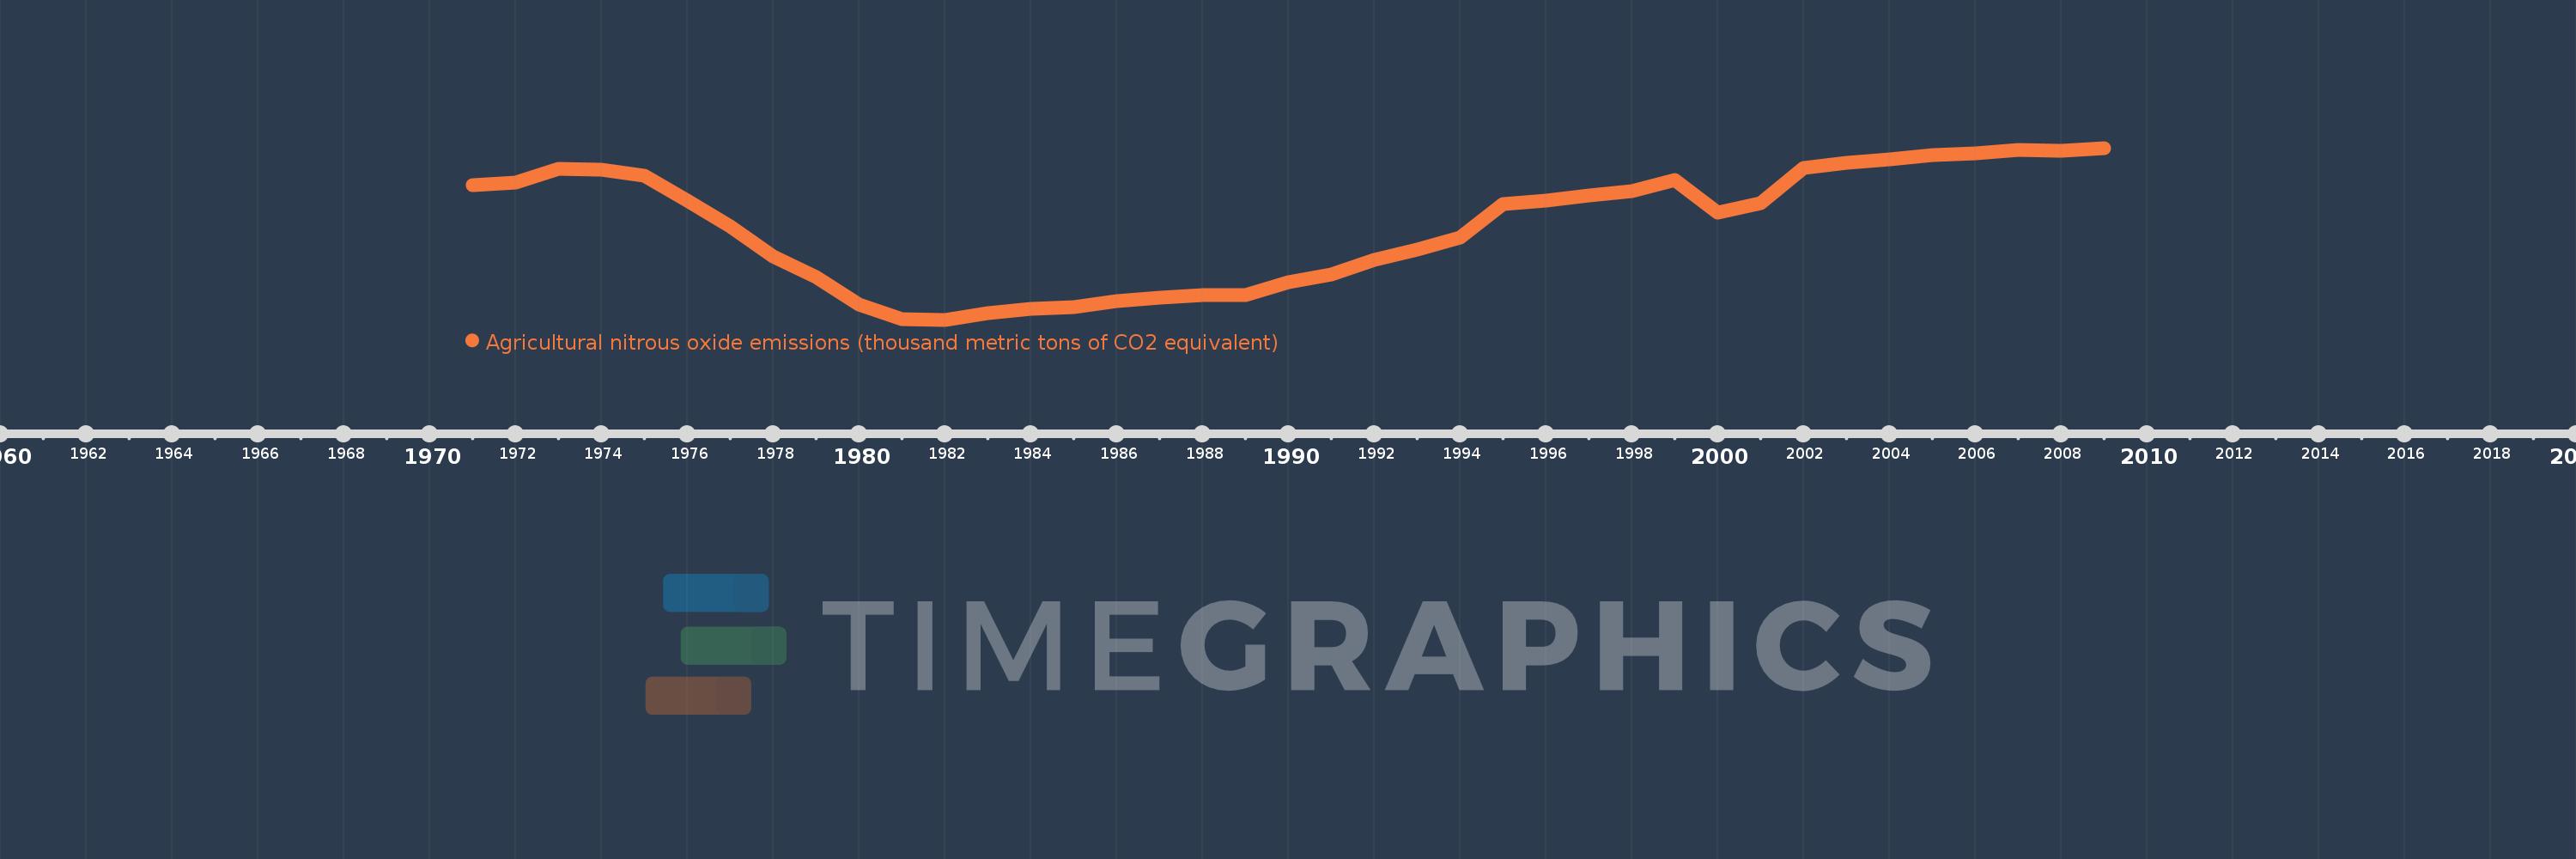
Agricultural nitrous oxide emissions (thousand metric tons of CO2 equivalent)
2009,2008,2007,2006,2005,2004,2003,2002,2001,2000,1999,1998,1997,1996,1995,1994,1993,1992,1991,1990,1989,1988,1987,1986,1985,1984,1983,1982,1981,1980,1979,1978,1977,1976,1975,1974,1973,1972,1971
This statistics in other country:
AfghanistanAlbaniaAlgeriaAmerican SamoaAndorraAngolaAntigua and BarbudaArab WorldArgentinaArmeniaArubaAustraliaAustriaAzerbaijanBahamas, TheBahrainBangladeshBarbadosBelarusBelgiumBelizeBeninBermudaBhutanBoliviaBosnia and HerzegovinaBotswanaBrazilBritish Virgin IslandsBrunei DarussalamBulgariaBurkina FasoBurundiCabo VerdeCambodiaCameroonCanadaCaribbean small statesCayman IslandsCentral African RepublicCentral Europe and the BalticsChadChannel IslandsChileChinaColombiaComorosCongo, Dem. Rep.Congo, Rep.Costa RicaCote d'IvoireCroatiaCubaCuracaoCyprusCzech RepublicDenmarkDjiboutiDominicaDominican RepublicEarly-demographic dividendEast Asia & PacificEast Asia & Pacific (excluding high income)East Asia & Pacific (IDA & IBRD countries)EcuadorEgypt, Arab Rep.El SalvadorEquatorial GuineaEritreaEstoniaEthiopiaEuro areaEurope & Central AsiaEurope & Central Asia (excluding high income)Europe & Central Asia (IDA & IBRD countries)European UnionFaroe IslandsFijiFinlandFragile and conflict affected situationsFranceFrench PolynesiaGabonGambia, TheGeorgiaGermanyGhanaGibraltarGreeceGreenlandGrenadaGuamGuatemalaGuineaGuinea-BissauGuyanaHaitiHeavily indebted poor countries (HIPC)High incomeHondurasHong Kong SAR, ChinaHungaryIBRD onlyIcelandIDA & IBRD totalIDA blendIDA onlyIDA totalIndiaIndonesiaIran, Islamic Rep.IraqIrelandIsle of ManIsraelItalyJamaicaJapanJordanKazakhstanKenyaKiribatiKorea, Dem. People’s Rep.Korea, Rep.KosovoKuwaitKyrgyz RepublicLao PDRLate-demographic dividendLatin America & Caribbean Latin America & Caribbean (excluding high income)Latin America & the Caribbean (IDA & IBRD countries)LatviaLeast developed countries: UN classificationLebanonLesothoLiberiaLibyaLiechtensteinLithuaniaLow & middle incomeLow incomeLower middle incomeLuxembourgMacao SAR, ChinaMacedonia, FYRMadagascarMalawiMalaysiaMaldivesMaliMaltaMarshall IslandsMauritaniaMauritiusMexicoMicronesia, Fed. Sts.Middle East & North AfricaMiddle East & North Africa (excluding high income)Middle East & North Africa (IDA & IBRD countries)Middle incomeMoldovaMonacoMongoliaMontenegroMoroccoMozambiqueMyanmarNamibiaNauruNepalNetherlandsNew CaledoniaNew ZealandNicaraguaNigerNigeriaNorth AmericaNorthern Mariana IslandsNorwayOECD membersOmanOther small statesPacific island small statesPakistanPalauPanamaPapua New GuineaParaguayPeruPhilippinesPolandPortugalPost-demographic dividendPre-demographic dividendPuerto RicoQatarRomaniaRussian FederationRwandaSamoaSan MarinoSao Tome and PrincipeSaudi ArabiaSenegalSerbiaSeychellesSierra LeoneSingaporeSint Maarten (Dutch part)Slovak RepublicSloveniaSmall statesSolomon IslandsSomaliaSouth AfricaSouth AsiaSouth Asia (IDA & IBRD)South SudanSpainSri LankaSt. Kitts and NevisSt. LuciaSt. Martin (French part)St. Vincent and the GrenadinesSub-Saharan Africa Sub-Saharan Africa (excluding high income)Sub-Saharan Africa (IDA & IBRD countries)SudanSurinameSwazilandSwedenSwitzerlandSyrian Arab RepublicTajikistanTanzaniaThailandTimor-LesteTogoTongaTrinidad and TobagoTunisiaTurkeyTurkmenistanTurks and Caicos IslandsTuvaluUgandaUkraineUnited Arab EmiratesUnited KingdomUnited StatesUpper middle incomeUruguayUzbekistanVanuatuVenezuela, RBVietnamVirgin Islands (U.S.)West Bank and GazaWorldYemen, Rep.ZambiaZimbabwe Timeline:
This timeline shows a graph from 1971 to 2009 of Timor-Leste. No data until 1970. Number of actual observations by date: 39.
Source name:
World Development Indicators
Source organization:
European Commission, Joint Research Centre (JRC)/Netherlands Environmental Assessment Agency (PBL). Emission Database for Global Atmospheric Research (EDGAR): http://edgar.jrc.ec.europa.eu/
Categories, topics:
Agriculture & Rural Development, Environment
Last updated:
apr 23, 2017
Indicators value changes by year
Minimum:
61.413
jan 1, 1982
Maximum:
188.619
jan 1, 2009
At the date of observation
Value
Absolute change
Change from previous value
jan 1, 1971
160.975
+160.975
0.0%
jan 1, 1972
163.252
+2.276
1.41%
jan 1, 1973
173.225
+9.974
6.11%
jan 1, 1974
172.275
-0.95
-0.55%
jan 1, 1975
167.831
-4.445
-2.58%
jan 1, 1976
149.365
-18.466
-11.0%
jan 1, 1977
130.46
-18.905
-12.66%
jan 1, 1978
108.389
-22.071
-16.92%
jan 1, 1979
93.021
-15.368
-14.18%
jan 1, 1980
72.503
-20.518
-22.06%
jan 1, 1981
61.929
-10.574
-14.58%
jan 1, 1982
61.413
-0.516
-0.83%
jan 1, 1983
66.129
+4.716
7.68%
jan 1, 1984
69.433
+3.305
5.0%
jan 1, 1985
70.927
+1.493
2.15%
jan 1, 1986
74.999
+4.073
5.74%
jan 1, 1987
77.711
+2.712
3.62%
jan 1, 1988
79.897
+2.186
2.81%
jan 1, 1989
79.37
-0.527
-0.66%
jan 1, 1990
88.911
+9.541
12.02%
jan 1, 1991
94.853
+5.942
6.68%
jan 1, 1992
105.528
+10.675
11.25%
jan 1, 1993
113.252
+7.724
7.32%
jan 1, 1994
122.038
+8.786
7.76%
jan 1, 1995
147.221
+25.183
20.64%
jan 1, 1996
149.363
+2.141
1.45%
jan 1, 1997
153.527
+4.164
2.79%
jan 1, 1998
156.742
+3.215
2.09%
jan 1, 1999
164.865
+8.124
5.18%
jan 1, 2000
140.566
-24.299
-14.74%
jan 1, 2001
147.484
+6.918
4.92%
jan 1, 2002
173.509
+26.025
17.65%
jan 1, 2003
177.446
+3.937
2.27%
jan 1, 2004
180.22
+2.774
1.56%
jan 1, 2005
183.549
+3.329
1.85%
jan 1, 2006
184.852
+1.303
0.71%
jan 1, 2007
187.041
+2.189
1.18%
jan 1, 2008
186.69
-0.35
-0.19%
jan 1, 2009
188.619
+1.929
1.03%
Ranking of countries by current statistics by years


Comments: