29
/
en
AIzaSyAYiBZKx7MnpbEhh9jyipgxe19OcubqV5w
April 1, 2024
44811
Low & middle income
LMY
false
2
1
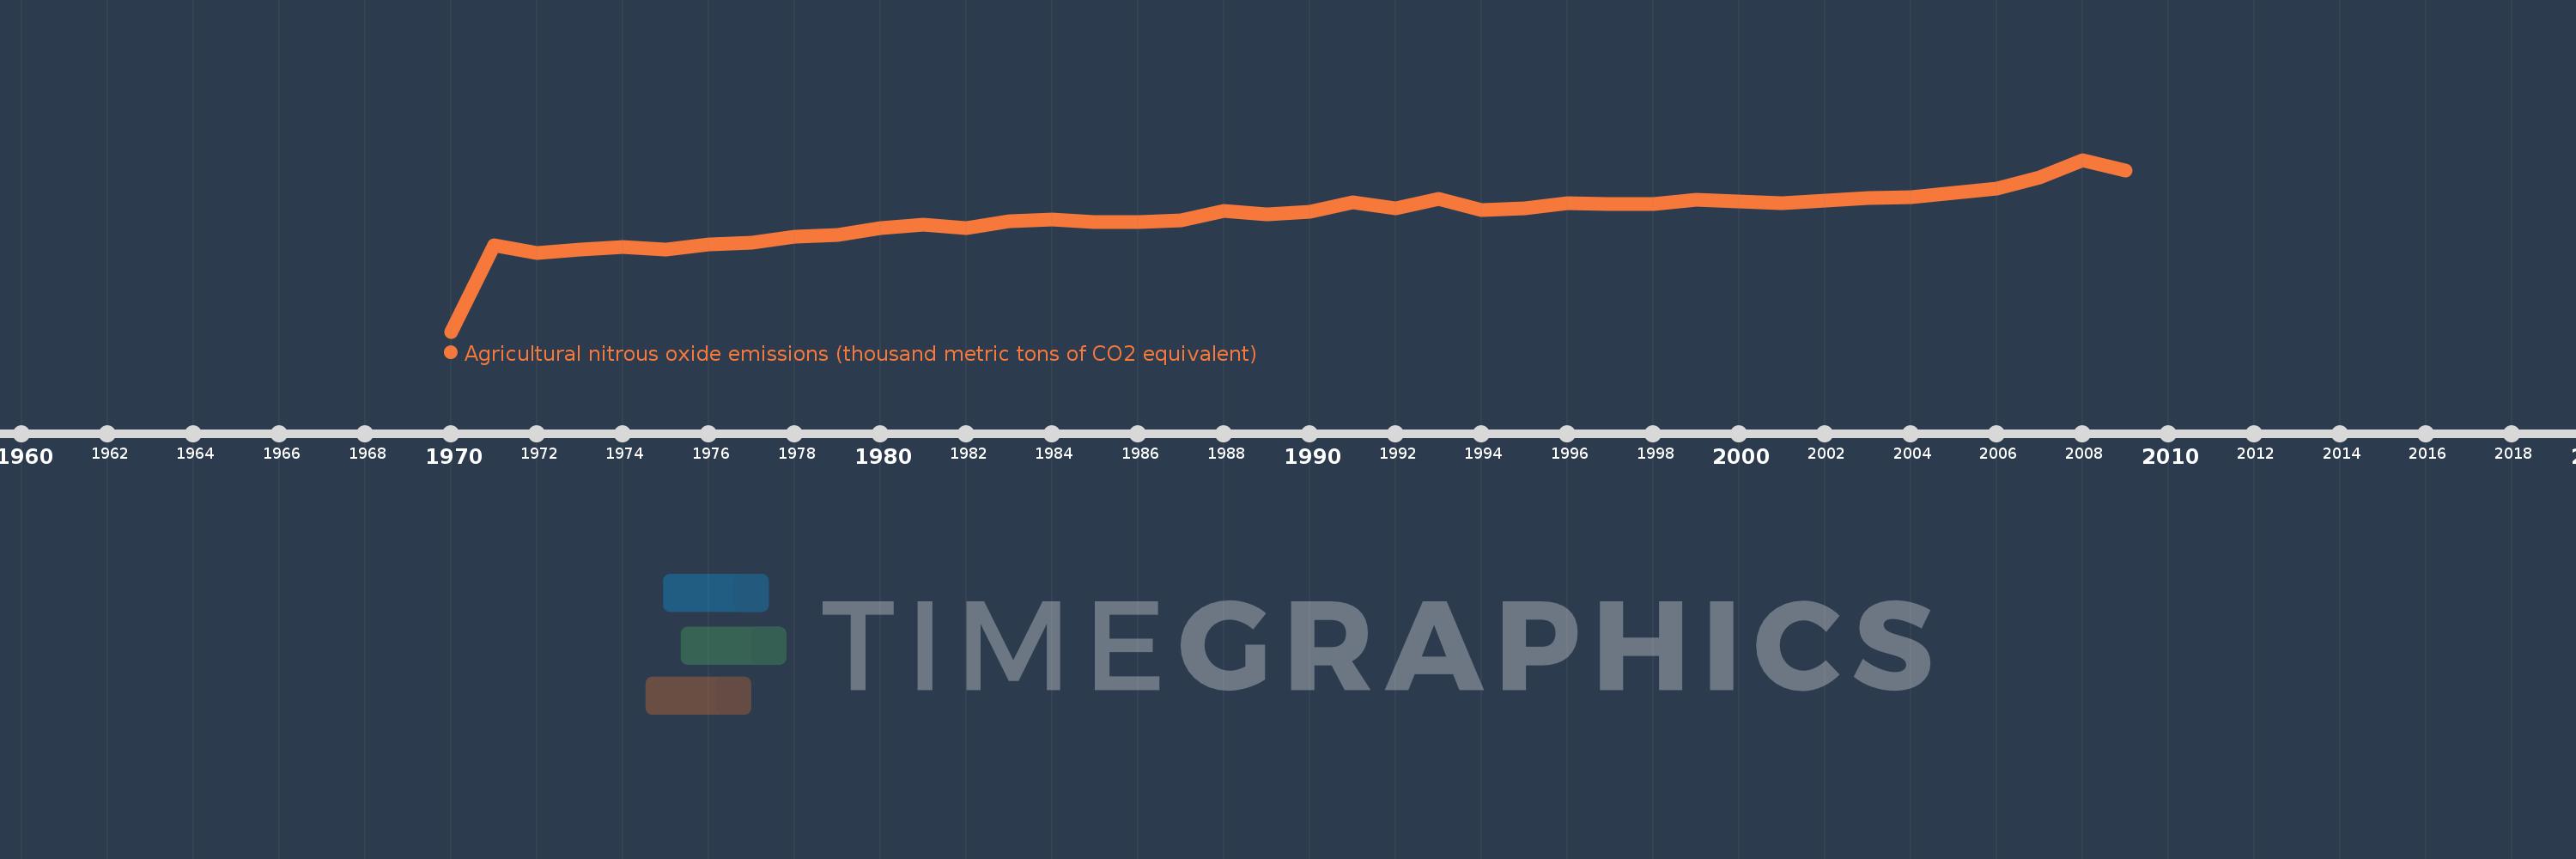
Agricultural nitrous oxide emissions (thousand metric tons of CO2 equivalent)
2009,2008,2007,2006,2005,2004,2003,2002,2001,2000,1999,1998,1997,1996,1995,1994,1993,1992,1991,1990,1989,1988,1987,1986,1985,1984,1983,1982,1981,1980,1979,1978,1977,1976,1975,1974,1973,1972,1971,1970
This statistics in other country:
AfghanistanAlbaniaAlgeriaAmerican SamoaAndorraAngolaAntigua and BarbudaArab WorldArgentinaArmeniaArubaAustraliaAustriaAzerbaijanBahamas, TheBahrainBangladeshBarbadosBelarusBelgiumBelizeBeninBermudaBhutanBoliviaBosnia and HerzegovinaBotswanaBrazilBritish Virgin IslandsBrunei DarussalamBulgariaBurkina FasoBurundiCabo VerdeCambodiaCameroonCanadaCaribbean small statesCayman IslandsCentral African RepublicCentral Europe and the BalticsChadChannel IslandsChileChinaColombiaComorosCongo, Dem. Rep.Congo, Rep.Costa RicaCote d'IvoireCroatiaCubaCuracaoCyprusCzech RepublicDenmarkDjiboutiDominicaDominican RepublicEarly-demographic dividendEast Asia & PacificEast Asia & Pacific (excluding high income)East Asia & Pacific (IDA & IBRD countries)EcuadorEgypt, Arab Rep.El SalvadorEquatorial GuineaEritreaEstoniaEthiopiaEuro areaEurope & Central AsiaEurope & Central Asia (excluding high income)Europe & Central Asia (IDA & IBRD countries)European UnionFaroe IslandsFijiFinlandFragile and conflict affected situationsFranceFrench PolynesiaGabonGambia, TheGeorgiaGermanyGhanaGibraltarGreeceGreenlandGrenadaGuamGuatemalaGuineaGuinea-BissauGuyanaHaitiHeavily indebted poor countries (HIPC)High incomeHondurasHong Kong SAR, ChinaHungaryIBRD onlyIcelandIDA & IBRD totalIDA blendIDA onlyIDA totalIndiaIndonesiaIran, Islamic Rep.IraqIrelandIsle of ManIsraelItalyJamaicaJapanJordanKazakhstanKenyaKiribatiKorea, Dem. People’s Rep.Korea, Rep.KosovoKuwaitKyrgyz RepublicLao PDRLate-demographic dividendLatin America & Caribbean Latin America & Caribbean (excluding high income)Latin America & the Caribbean (IDA & IBRD countries)LatviaLeast developed countries: UN classificationLebanonLesothoLiberiaLibyaLiechtensteinLithuaniaLow & middle incomeLow incomeLower middle incomeLuxembourgMacao SAR, ChinaMacedonia, FYRMadagascarMalawiMalaysiaMaldivesMaliMaltaMarshall IslandsMauritaniaMauritiusMexicoMicronesia, Fed. Sts.Middle East & North AfricaMiddle East & North Africa (excluding high income)Middle East & North Africa (IDA & IBRD countries)Middle incomeMoldovaMonacoMongoliaMontenegroMoroccoMozambiqueMyanmarNamibiaNauruNepalNetherlandsNew CaledoniaNew ZealandNicaraguaNigerNigeriaNorth AmericaNorthern Mariana IslandsNorwayOECD membersOmanOther small statesPacific island small statesPakistanPalauPanamaPapua New GuineaParaguayPeruPhilippinesPolandPortugalPost-demographic dividendPre-demographic dividendPuerto RicoQatarRomaniaRussian FederationRwandaSamoaSan MarinoSao Tome and PrincipeSaudi ArabiaSenegalSerbiaSeychellesSierra LeoneSingaporeSint Maarten (Dutch part)Slovak RepublicSloveniaSmall statesSolomon IslandsSomaliaSouth AfricaSouth AsiaSouth Asia (IDA & IBRD)South SudanSpainSri LankaSt. Kitts and NevisSt. LuciaSt. Martin (French part)St. Vincent and the GrenadinesSub-Saharan Africa Sub-Saharan Africa (excluding high income)Sub-Saharan Africa (IDA & IBRD countries)SudanSurinameSwazilandSwedenSwitzerlandSyrian Arab RepublicTajikistanTanzaniaThailandTimor-LesteTogoTongaTrinidad and TobagoTunisiaTurkeyTurkmenistanTurks and Caicos IslandsTuvaluUgandaUkraineUnited Arab EmiratesUnited KingdomUnited StatesUpper middle incomeUruguayUzbekistanVanuatuVenezuela, RBVietnamVirgin Islands (U.S.)West Bank and GazaWorldYemen, Rep.ZambiaZimbabwe Timeline:
This timeline shows a graph from 1970 to 2009 of Low & middle income. No data until 1969. Number of actual observations by date: 40.
Source name:
World Development Indicators
Source organization:
European Commission, Joint Research Centre (JRC)/Netherlands Environmental Assessment Agency (PBL). Emission Database for Global Atmospheric Research (EDGAR): http://edgar.jrc.ec.europa.eu/
Categories, topics:
Agriculture & Rural Development, Environment
Last updated:
apr 23, 2017
Indicators value changes by year
Maximum:
1.764 mln
jan 1, 2008
At the date of observation
Value
Absolute change
Change from previous value
jan 1, 1971
883.775K
+883.775K
%
jan 1, 1972
807.206K
-76.569K
-8.66%
jan 1, 1973
842.249K
+35.044K
4.34%
jan 1, 1974
871.768K
+29.519K
3.5%
jan 1, 1975
838.065K
-33.703K
-3.87%
jan 1, 1976
895.034K
+56.969K
6.8%
jan 1, 1977
914.904K
+19.87K
2.22%
jan 1, 1978
977.019K
+62.115K
6.79%
jan 1, 1979
991.837K
+14.818K
1.52%
jan 1, 1980
1.065 mln
+73.376K
7.4%
jan 1, 1981
1.096 mln
+30.532K
2.87%
jan 1, 1982
1.06 mln
-35.303K
-3.22%
jan 1, 1983
1.131 mln
+70.112K
6.61%
jan 1, 1984
1.152 mln
+21.115K
1.87%
jan 1, 1985
1.125 mln
-26.684K
-2.32%
jan 1, 1986
1.122 mln
-3.193K
-0.28%
jan 1, 1987
1.145 mln
+22.896K
2.04%
jan 1, 1988
1.236 mln
+91.463K
7.99%
jan 1, 1989
1.202 mln
-33.878K
-2.74%
jan 1, 1990
1.232 mln
+29.25K
2.43%
jan 1, 1991
1.328 mln
+96.115K
7.8%
jan 1, 1992
1.263 mln
-64.82K
-4.88%
jan 1, 1993
1.364 mln
+101.459K
8.03%
jan 1, 1994
1.249 mln
-115.176K
-8.44%
jan 1, 1995
1.267 mln
+17.718K
1.42%
jan 1, 1996
1.322 mln
+55.076K
4.35%
jan 1, 1997
1.312 mln
-9.747K
-0.74%
jan 1, 1998
1.311 mln
-1.195K
-0.09%
jan 1, 1999
1.352 mln
+41.021K
3.13%
jan 1, 2000
1.333 mln
-18.527K
-1.37%
jan 1, 2001
1.32 mln
-13.316K
-1.0%
jan 1, 2002
1.347 mln
+26.927K
2.04%
jan 1, 2003
1.372 mln
+25.115K
1.86%
jan 1, 2004
1.383 mln
+11.186K
0.82%
jan 1, 2005
1.427 mln
+44.007K
3.18%
jan 1, 2006
1.472 mln
+45.074K
3.16%
jan 1, 2007
1.579 mln
+106.266K
7.22%
jan 1, 2008
1.764 mln
+184.826K
11.71%
jan 1, 2009
1.652 mln
-111.871K
-6.34%
Ranking of countries by current statistics by years


Comments: