29
/
en
AIzaSyAYiBZKx7MnpbEhh9jyipgxe19OcubqV5w
April 1, 2024
248302
Sri Lanka
LKA
true
2
1
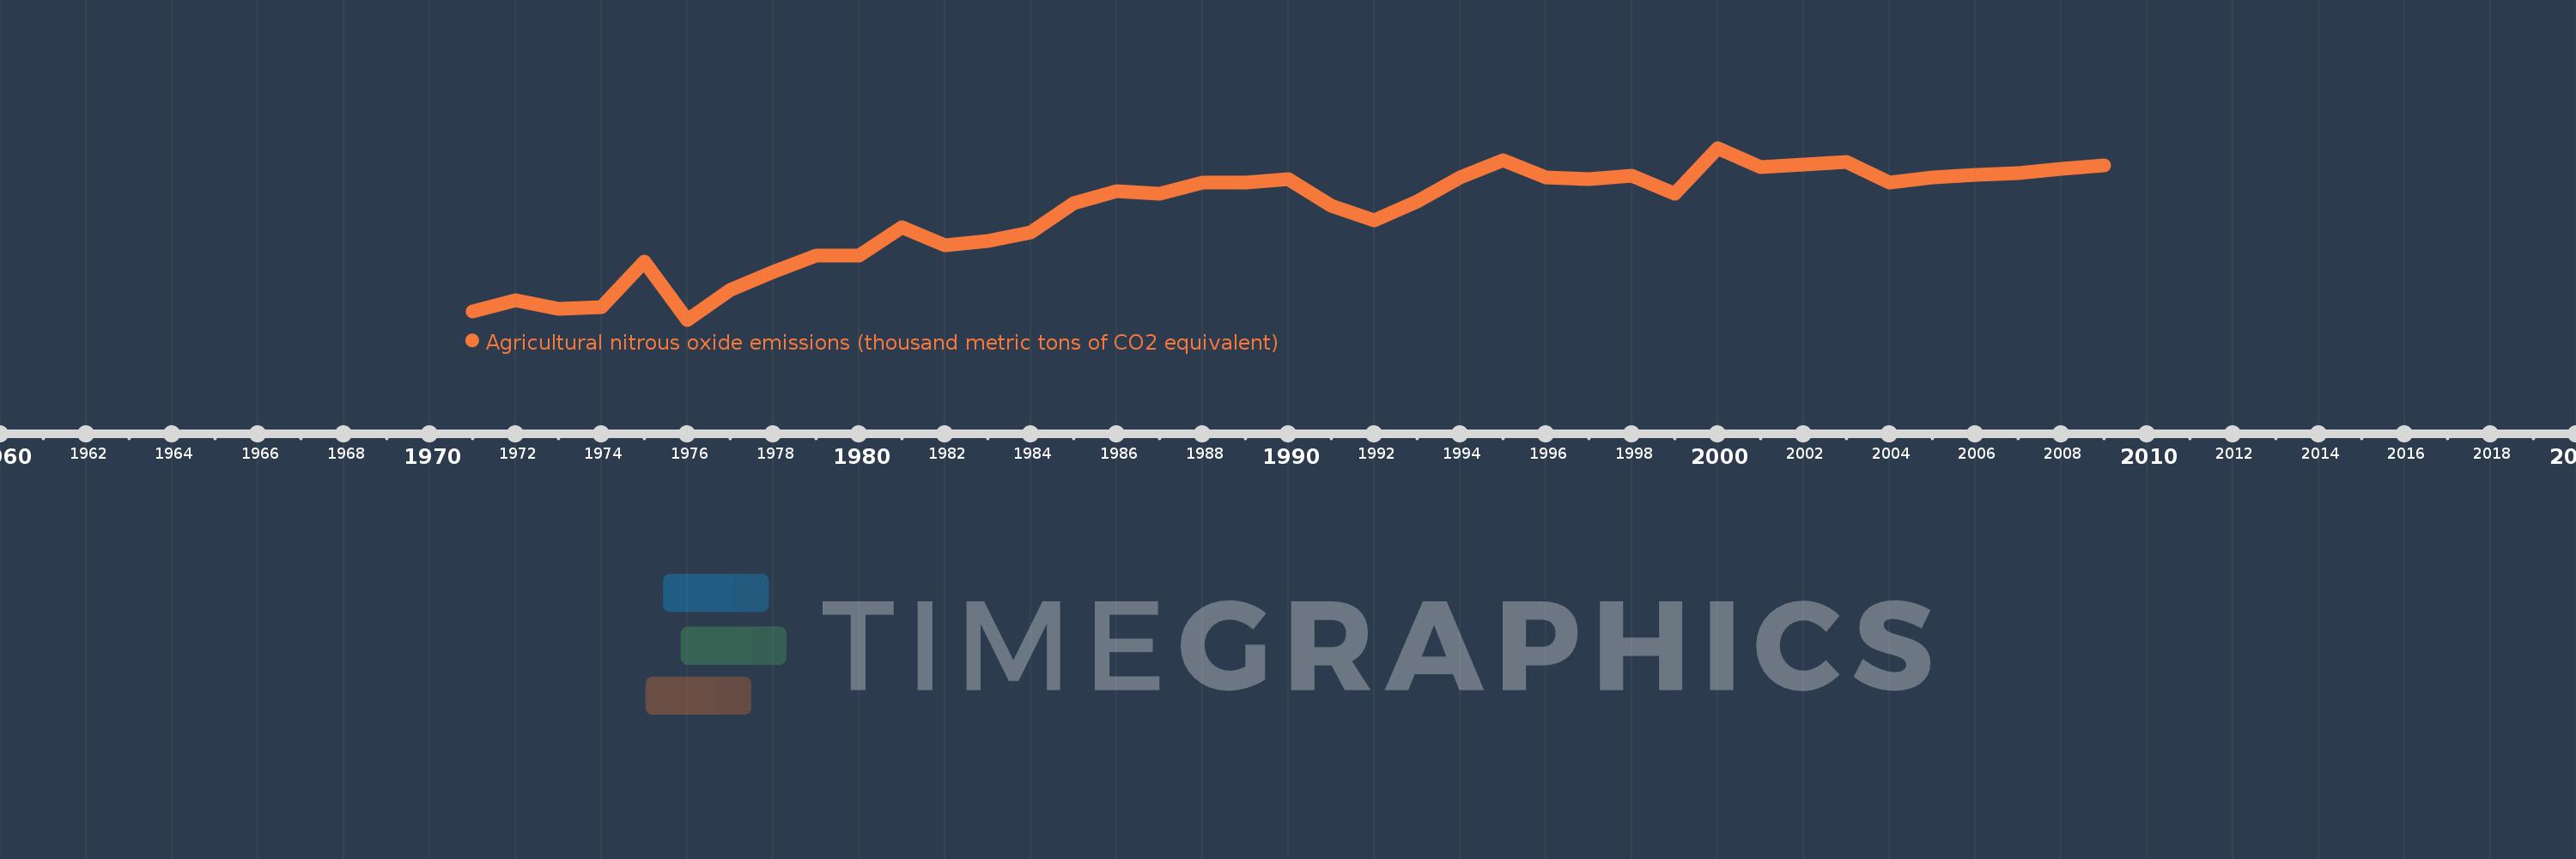
Agricultural nitrous oxide emissions (thousand metric tons of CO2 equivalent)
2009,2008,2007,2006,2005,2004,2003,2002,2001,2000,1999,1998,1997,1996,1995,1994,1993,1992,1991,1990,1989,1988,1987,1986,1985,1984,1983,1982,1981,1980,1979,1978,1977,1976,1975,1974,1973,1972,1971
This statistics in other country:
AfghanistanAlbaniaAlgeriaAmerican SamoaAndorraAngolaAntigua and BarbudaArab WorldArgentinaArmeniaArubaAustraliaAustriaAzerbaijanBahamas, TheBahrainBangladeshBarbadosBelarusBelgiumBelizeBeninBermudaBhutanBoliviaBosnia and HerzegovinaBotswanaBrazilBritish Virgin IslandsBrunei DarussalamBulgariaBurkina FasoBurundiCabo VerdeCambodiaCameroonCanadaCaribbean small statesCayman IslandsCentral African RepublicCentral Europe and the BalticsChadChannel IslandsChileChinaColombiaComorosCongo, Dem. Rep.Congo, Rep.Costa RicaCote d'IvoireCroatiaCubaCuracaoCyprusCzech RepublicDenmarkDjiboutiDominicaDominican RepublicEarly-demographic dividendEast Asia & PacificEast Asia & Pacific (excluding high income)East Asia & Pacific (IDA & IBRD countries)EcuadorEgypt, Arab Rep.El SalvadorEquatorial GuineaEritreaEstoniaEthiopiaEuro areaEurope & Central AsiaEurope & Central Asia (excluding high income)Europe & Central Asia (IDA & IBRD countries)European UnionFaroe IslandsFijiFinlandFragile and conflict affected situationsFranceFrench PolynesiaGabonGambia, TheGeorgiaGermanyGhanaGibraltarGreeceGreenlandGrenadaGuamGuatemalaGuineaGuinea-BissauGuyanaHaitiHeavily indebted poor countries (HIPC)High incomeHondurasHong Kong SAR, ChinaHungaryIBRD onlyIcelandIDA & IBRD totalIDA blendIDA onlyIDA totalIndiaIndonesiaIran, Islamic Rep.IraqIrelandIsle of ManIsraelItalyJamaicaJapanJordanKazakhstanKenyaKiribatiKorea, Dem. People’s Rep.Korea, Rep.KosovoKuwaitKyrgyz RepublicLao PDRLate-demographic dividendLatin America & Caribbean Latin America & Caribbean (excluding high income)Latin America & the Caribbean (IDA & IBRD countries)LatviaLeast developed countries: UN classificationLebanonLesothoLiberiaLibyaLiechtensteinLithuaniaLow & middle incomeLow incomeLower middle incomeLuxembourgMacao SAR, ChinaMacedonia, FYRMadagascarMalawiMalaysiaMaldivesMaliMaltaMarshall IslandsMauritaniaMauritiusMexicoMicronesia, Fed. Sts.Middle East & North AfricaMiddle East & North Africa (excluding high income)Middle East & North Africa (IDA & IBRD countries)Middle incomeMoldovaMonacoMongoliaMontenegroMoroccoMozambiqueMyanmarNamibiaNauruNepalNetherlandsNew CaledoniaNew ZealandNicaraguaNigerNigeriaNorth AmericaNorthern Mariana IslandsNorwayOECD membersOmanOther small statesPacific island small statesPakistanPalauPanamaPapua New GuineaParaguayPeruPhilippinesPolandPortugalPost-demographic dividendPre-demographic dividendPuerto RicoQatarRomaniaRussian FederationRwandaSamoaSan MarinoSao Tome and PrincipeSaudi ArabiaSenegalSerbiaSeychellesSierra LeoneSingaporeSint Maarten (Dutch part)Slovak RepublicSloveniaSmall statesSolomon IslandsSomaliaSouth AfricaSouth AsiaSouth Asia (IDA & IBRD)South SudanSpainSri LankaSt. Kitts and NevisSt. LuciaSt. Martin (French part)St. Vincent and the GrenadinesSub-Saharan Africa Sub-Saharan Africa (excluding high income)Sub-Saharan Africa (IDA & IBRD countries)SudanSurinameSwazilandSwedenSwitzerlandSyrian Arab RepublicTajikistanTanzaniaThailandTimor-LesteTogoTongaTrinidad and TobagoTunisiaTurkeyTurkmenistanTurks and Caicos IslandsTuvaluUgandaUkraineUnited Arab EmiratesUnited KingdomUnited StatesUpper middle incomeUruguayUzbekistanVanuatuVenezuela, RBVietnamVirgin Islands (U.S.)West Bank and GazaWorldYemen, Rep.ZambiaZimbabwe Timeline:
This timeline shows a graph from 1971 to 2009 of Sri Lanka. No data until 1970. Number of actual observations by date: 39.
Source name:
World Development Indicators
Source organization:
European Commission, Joint Research Centre (JRC)/Netherlands Environmental Assessment Agency (PBL). Emission Database for Global Atmospheric Research (EDGAR): http://edgar.jrc.ec.europa.eu/
Categories, topics:
Agriculture & Rural Development, Environment
Last updated:
apr 23, 2017
Indicators value changes by year
Minimum:
820.061
jan 1, 1976
Maximum:
1.435K
jan 1, 2000
At the date of observation
Value
Absolute change
Change from previous value
jan 1, 1971
848.728
+848.728
0.0%
jan 1, 1972
891.31
+42.582
5.02%
jan 1, 1973
858.069
-33.241
-3.73%
jan 1, 1974
865.512
+7.443
0.87%
jan 1, 1975
1.027K
+161.189
18.62%
jan 1, 1976
820.061
-206.64
-20.13%
jan 1, 1977
927.202
+107.141
13.07%
jan 1, 1978
991.999
+64.797
6.99%
jan 1, 1979
1.049K
+57.164
5.76%
jan 1, 1980
1.05K
+0.466
0.04%
jan 1, 1981
1.15K
+100.397
9.57%
jan 1, 1982
1.085K
-65.006
-5.65%
jan 1, 1983
1.103K
+17.715
1.63%
jan 1, 1984
1.132K
+28.927
2.62%
jan 1, 1985
1.237K
+104.846
9.26%
jan 1, 1986
1.281K
+44.324
3.58%
jan 1, 1987
1.27K
-10.44
-0.82%
jan 1, 1988
1.31K
+40.106
3.16%
jan 1, 1989
1.309K
-1.077
-0.08%
jan 1, 1990
1.325K
+15.194
1.16%
jan 1, 1991
1.228K
-96.934
-7.32%
jan 1, 1992
1.174K
-53.291
-4.34%
jan 1, 1993
1.244K
+69.326
5.9%
jan 1, 1994
1.329K
+85.632
6.89%
jan 1, 1995
1.39K
+60.211
4.53%
jan 1, 1996
1.33K
-59.382
-4.27%
jan 1, 1997
1.324K
-6.507
-0.49%
jan 1, 1998
1.335K
+11.065
0.84%
jan 1, 1999
1.272K
-62.742
-4.7%
jan 1, 2000
1.435K
+162.761
12.8%
jan 1, 2001
1.365K
-69.456
-4.84%
jan 1, 2002
1.377K
+11.312
0.83%
jan 1, 2003
1.385K
+7.898
0.57%
jan 1, 2004
1.312K
-72.456
-5.23%
jan 1, 2005
1.331K
+18.69
1.42%
jan 1, 2006
1.338K
+7.316
0.55%
jan 1, 2007
1.345K
+6.674
0.5%
jan 1, 2008
1.359K
+13.921
1.04%
jan 1, 2009
1.371K
+12.397
0.91%
Ranking of countries by current statistics by years


Comments: