29
/
en
AIzaSyAYiBZKx7MnpbEhh9jyipgxe19OcubqV5w
April 1, 2024
68582
Antigua and Barbuda
ATG
true
2
1
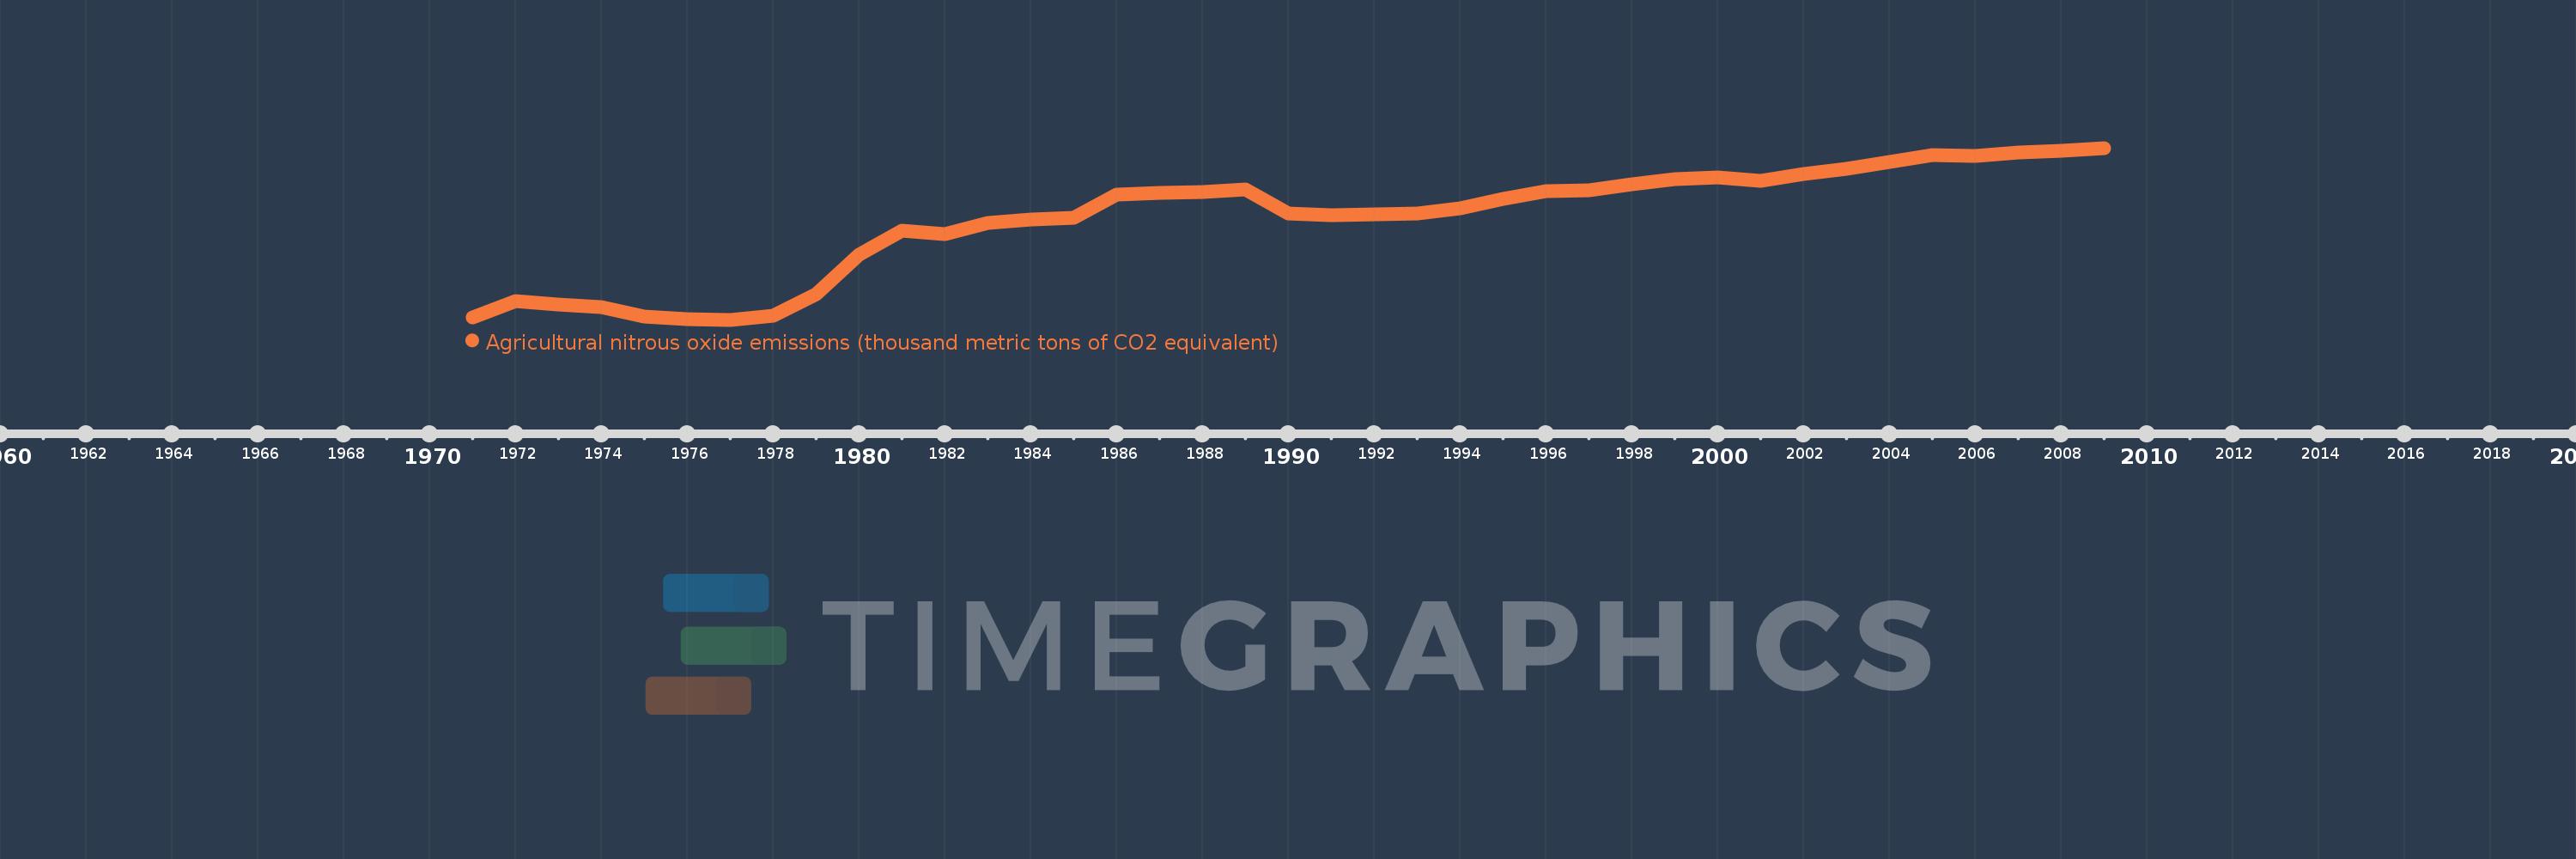
Agricultural nitrous oxide emissions (thousand metric tons of CO2 equivalent)
2009,2008,2007,2006,2005,2004,2003,2002,2001,2000,1999,1998,1997,1996,1995,1994,1993,1992,1991,1990,1989,1988,1987,1986,1985,1984,1983,1982,1981,1980,1979,1978,1977,1976,1975,1974,1973,1972,1971
This statistics in other country:
AfghanistanAlbaniaAlgeriaAmerican SamoaAndorraAngolaAntigua and BarbudaArab WorldArgentinaArmeniaArubaAustraliaAustriaAzerbaijanBahamas, TheBahrainBangladeshBarbadosBelarusBelgiumBelizeBeninBermudaBhutanBoliviaBosnia and HerzegovinaBotswanaBrazilBritish Virgin IslandsBrunei DarussalamBulgariaBurkina FasoBurundiCabo VerdeCambodiaCameroonCanadaCaribbean small statesCayman IslandsCentral African RepublicCentral Europe and the BalticsChadChannel IslandsChileChinaColombiaComorosCongo, Dem. Rep.Congo, Rep.Costa RicaCote d'IvoireCroatiaCubaCuracaoCyprusCzech RepublicDenmarkDjiboutiDominicaDominican RepublicEarly-demographic dividendEast Asia & PacificEast Asia & Pacific (excluding high income)East Asia & Pacific (IDA & IBRD countries)EcuadorEgypt, Arab Rep.El SalvadorEquatorial GuineaEritreaEstoniaEthiopiaEuro areaEurope & Central AsiaEurope & Central Asia (excluding high income)Europe & Central Asia (IDA & IBRD countries)European UnionFaroe IslandsFijiFinlandFragile and conflict affected situationsFranceFrench PolynesiaGabonGambia, TheGeorgiaGermanyGhanaGibraltarGreeceGreenlandGrenadaGuamGuatemalaGuineaGuinea-BissauGuyanaHaitiHeavily indebted poor countries (HIPC)High incomeHondurasHong Kong SAR, ChinaHungaryIBRD onlyIcelandIDA & IBRD totalIDA blendIDA onlyIDA totalIndiaIndonesiaIran, Islamic Rep.IraqIrelandIsle of ManIsraelItalyJamaicaJapanJordanKazakhstanKenyaKiribatiKorea, Dem. People’s Rep.Korea, Rep.KosovoKuwaitKyrgyz RepublicLao PDRLate-demographic dividendLatin America & Caribbean Latin America & Caribbean (excluding high income)Latin America & the Caribbean (IDA & IBRD countries)LatviaLeast developed countries: UN classificationLebanonLesothoLiberiaLibyaLiechtensteinLithuaniaLow & middle incomeLow incomeLower middle incomeLuxembourgMacao SAR, ChinaMacedonia, FYRMadagascarMalawiMalaysiaMaldivesMaliMaltaMarshall IslandsMauritaniaMauritiusMexicoMicronesia, Fed. Sts.Middle East & North AfricaMiddle East & North Africa (excluding high income)Middle East & North Africa (IDA & IBRD countries)Middle incomeMoldovaMonacoMongoliaMontenegroMoroccoMozambiqueMyanmarNamibiaNauruNepalNetherlandsNew CaledoniaNew ZealandNicaraguaNigerNigeriaNorth AmericaNorthern Mariana IslandsNorwayOECD membersOmanOther small statesPacific island small statesPakistanPalauPanamaPapua New GuineaParaguayPeruPhilippinesPolandPortugalPost-demographic dividendPre-demographic dividendPuerto RicoQatarRomaniaRussian FederationRwandaSamoaSan MarinoSao Tome and PrincipeSaudi ArabiaSenegalSerbiaSeychellesSierra LeoneSingaporeSint Maarten (Dutch part)Slovak RepublicSloveniaSmall statesSolomon IslandsSomaliaSouth AfricaSouth AsiaSouth Asia (IDA & IBRD)South SudanSpainSri LankaSt. Kitts and NevisSt. LuciaSt. Martin (French part)St. Vincent and the GrenadinesSub-Saharan Africa Sub-Saharan Africa (excluding high income)Sub-Saharan Africa (IDA & IBRD countries)SudanSurinameSwazilandSwedenSwitzerlandSyrian Arab RepublicTajikistanTanzaniaThailandTimor-LesteTogoTongaTrinidad and TobagoTunisiaTurkeyTurkmenistanTurks and Caicos IslandsTuvaluUgandaUkraineUnited Arab EmiratesUnited KingdomUnited StatesUpper middle incomeUruguayUzbekistanVanuatuVenezuela, RBVietnamVirgin Islands (U.S.)West Bank and GazaWorldYemen, Rep.ZambiaZimbabwe Timeline:
This timeline shows a graph from 1971 to 2009 of Antigua and Barbuda. No data until 1970. Number of actual observations by date: 39.
Source name:
World Development Indicators
Source organization:
European Commission, Joint Research Centre (JRC)/Netherlands Environmental Assessment Agency (PBL). Emission Database for Global Atmospheric Research (EDGAR): http://edgar.jrc.ec.europa.eu/
Categories, topics:
Agriculture & Rural Development, Environment
Last updated:
apr 23, 2017
Indicators value changes by year
Maximum:
12.518
jan 1, 2009
At the date of observation
Value
Absolute change
Change from previous value
jan 1, 1971
5.716
+5.716
0.0%
jan 1, 1972
6.384
+0.668
11.69%
jan 1, 1973
6.251
-0.132
-2.07%
jan 1, 1974
6.142
-0.109
-1.75%
jan 1, 1975
5.752
-0.39
-6.35%
jan 1, 1976
5.653
-0.099
-1.72%
jan 1, 1977
5.628
-0.026
-0.45%
jan 1, 1978
5.781
+0.153
2.72%
jan 1, 1979
6.667
+0.887
15.34%
jan 1, 1980
8.225
+1.558
23.37%
jan 1, 1981
9.195
+0.97
11.79%
jan 1, 1982
9.047
-0.148
-1.61%
jan 1, 1983
9.51
+0.463
5.12%
jan 1, 1984
9.646
+0.135
1.42%
jan 1, 1985
9.723
+0.077
0.8%
jan 1, 1986
10.644
+0.921
9.48%
jan 1, 1987
10.718
+0.074
0.69%
jan 1, 1988
10.742
+0.025
0.23%
jan 1, 1989
10.846
+0.104
0.97%
jan 1, 1990
9.898
-0.949
-8.75%
jan 1, 1991
9.807
-0.091
-0.92%
jan 1, 1992
9.863
+0.057
0.58%
jan 1, 1993
9.88
+0.017
0.17%
jan 1, 1994
10.113
+0.233
2.35%
jan 1, 1995
10.48
+0.368
3.63%
jan 1, 1996
10.796
+0.315
3.01%
jan 1, 1997
10.831
+0.035
0.32%
jan 1, 1998
11.068
+0.237
2.19%
jan 1, 1999
11.257
+0.189
1.71%
jan 1, 2000
11.351
+0.094
0.84%
jan 1, 2001
11.202
-0.149
-1.31%
jan 1, 2002
11.49
+0.288
2.57%
jan 1, 2003
11.679
+0.188
1.64%
jan 1, 2004
11.969
+0.29
2.48%
jan 1, 2005
12.216
+0.247
2.06%
jan 1, 2006
12.211
-0.004
-0.04%
jan 1, 2007
12.348
+0.137
1.12%
jan 1, 2008
12.416
+0.068
0.55%
jan 1, 2009
12.518
+0.102
0.82%
Ranking of countries by current statistics by years


Comments: