29
/
en
AIzaSyAYiBZKx7MnpbEhh9jyipgxe19OcubqV5w
April 1, 2024
242313
Slovenia
SVN
true
2
1
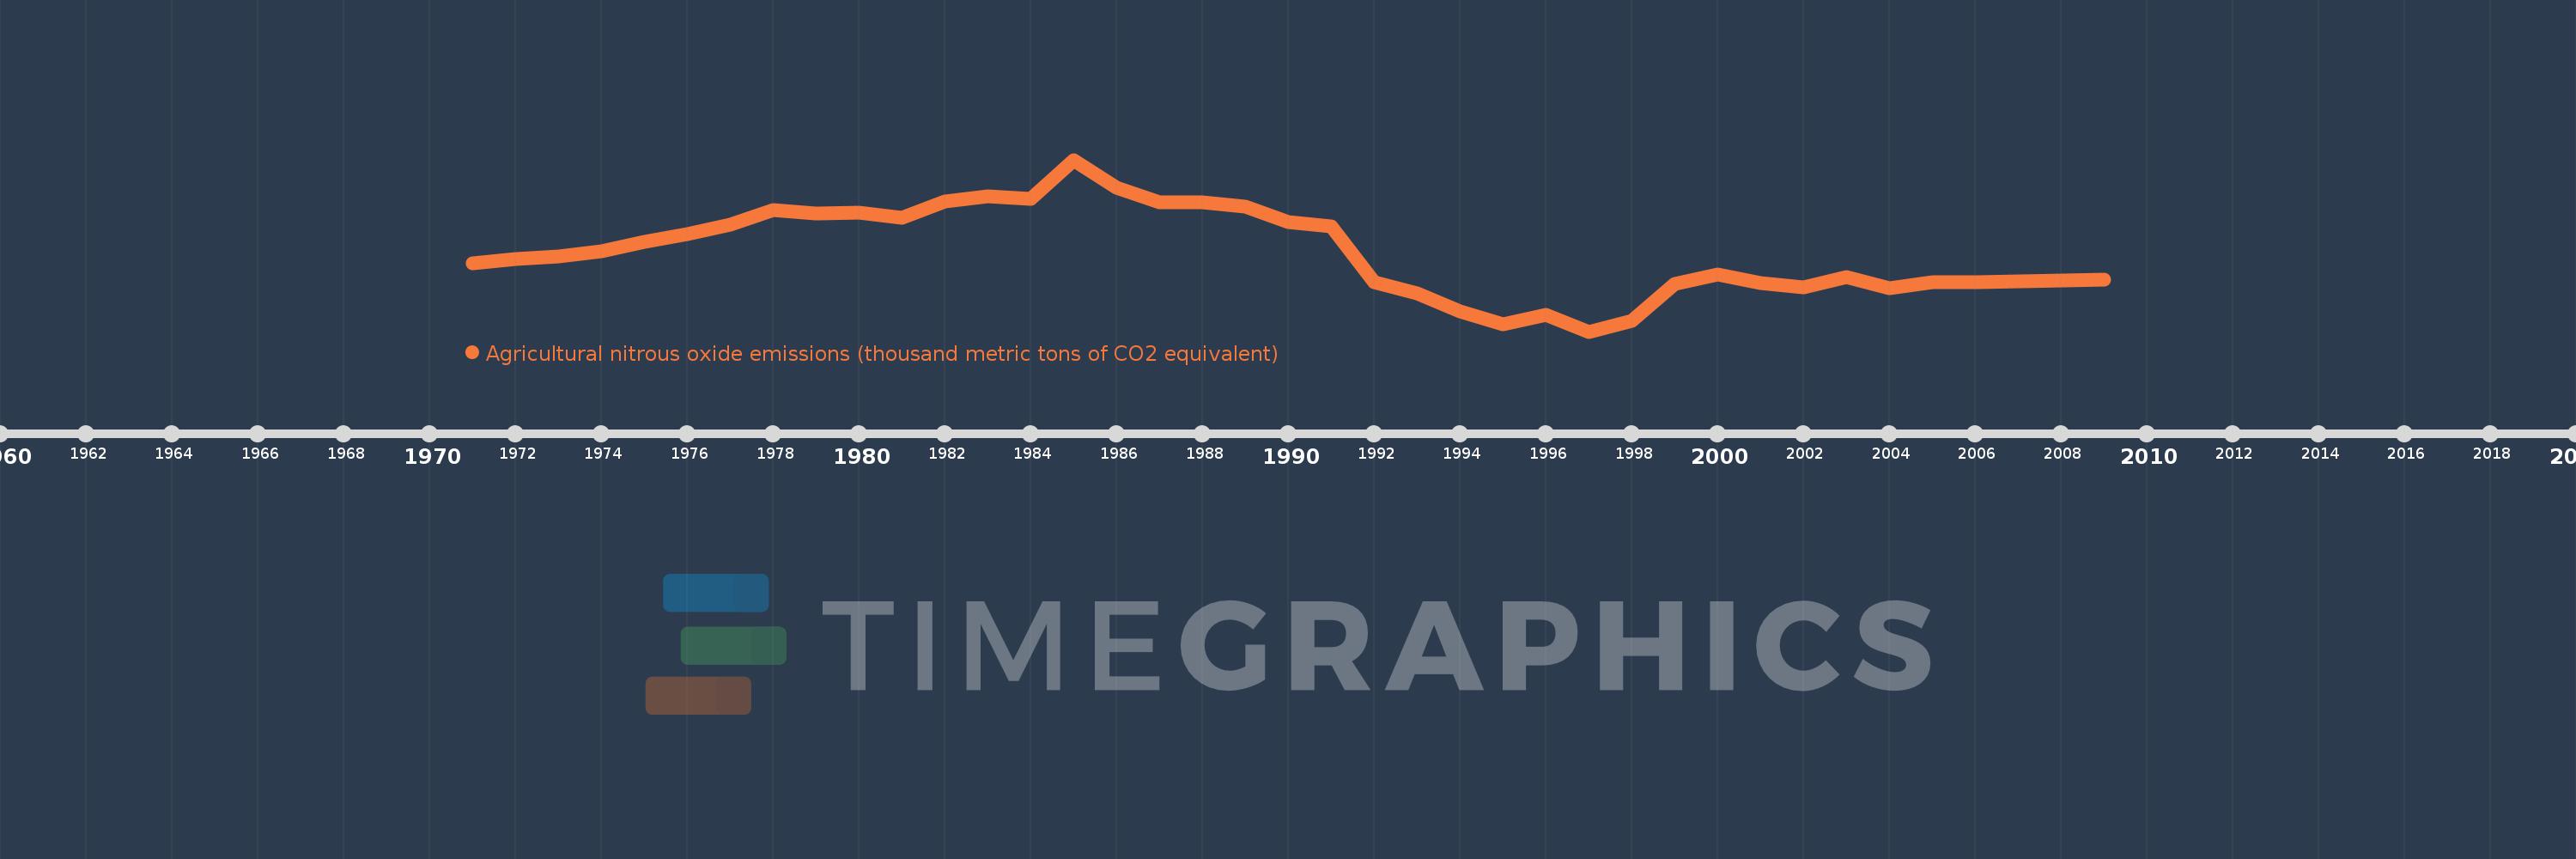
Agricultural nitrous oxide emissions (thousand metric tons of CO2 equivalent)
2009,2008,2007,2006,2005,2004,2003,2002,2001,2000,1999,1998,1997,1996,1995,1994,1993,1992,1991,1990,1989,1988,1987,1986,1985,1984,1983,1982,1981,1980,1979,1978,1977,1976,1975,1974,1973,1972,1971
This statistics in other country:
AfghanistanAlbaniaAlgeriaAmerican SamoaAndorraAngolaAntigua and BarbudaArab WorldArgentinaArmeniaArubaAustraliaAustriaAzerbaijanBahamas, TheBahrainBangladeshBarbadosBelarusBelgiumBelizeBeninBermudaBhutanBoliviaBosnia and HerzegovinaBotswanaBrazilBritish Virgin IslandsBrunei DarussalamBulgariaBurkina FasoBurundiCabo VerdeCambodiaCameroonCanadaCaribbean small statesCayman IslandsCentral African RepublicCentral Europe and the BalticsChadChannel IslandsChileChinaColombiaComorosCongo, Dem. Rep.Congo, Rep.Costa RicaCote d'IvoireCroatiaCubaCuracaoCyprusCzech RepublicDenmarkDjiboutiDominicaDominican RepublicEarly-demographic dividendEast Asia & PacificEast Asia & Pacific (excluding high income)East Asia & Pacific (IDA & IBRD countries)EcuadorEgypt, Arab Rep.El SalvadorEquatorial GuineaEritreaEstoniaEthiopiaEuro areaEurope & Central AsiaEurope & Central Asia (excluding high income)Europe & Central Asia (IDA & IBRD countries)European UnionFaroe IslandsFijiFinlandFragile and conflict affected situationsFranceFrench PolynesiaGabonGambia, TheGeorgiaGermanyGhanaGibraltarGreeceGreenlandGrenadaGuamGuatemalaGuineaGuinea-BissauGuyanaHaitiHeavily indebted poor countries (HIPC)High incomeHondurasHong Kong SAR, ChinaHungaryIBRD onlyIcelandIDA & IBRD totalIDA blendIDA onlyIDA totalIndiaIndonesiaIran, Islamic Rep.IraqIrelandIsle of ManIsraelItalyJamaicaJapanJordanKazakhstanKenyaKiribatiKorea, Dem. People’s Rep.Korea, Rep.KosovoKuwaitKyrgyz RepublicLao PDRLate-demographic dividendLatin America & Caribbean Latin America & Caribbean (excluding high income)Latin America & the Caribbean (IDA & IBRD countries)LatviaLeast developed countries: UN classificationLebanonLesothoLiberiaLibyaLiechtensteinLithuaniaLow & middle incomeLow incomeLower middle incomeLuxembourgMacao SAR, ChinaMacedonia, FYRMadagascarMalawiMalaysiaMaldivesMaliMaltaMarshall IslandsMauritaniaMauritiusMexicoMicronesia, Fed. Sts.Middle East & North AfricaMiddle East & North Africa (excluding high income)Middle East & North Africa (IDA & IBRD countries)Middle incomeMoldovaMonacoMongoliaMontenegroMoroccoMozambiqueMyanmarNamibiaNauruNepalNetherlandsNew CaledoniaNew ZealandNicaraguaNigerNigeriaNorth AmericaNorthern Mariana IslandsNorwayOECD membersOmanOther small statesPacific island small statesPakistanPalauPanamaPapua New GuineaParaguayPeruPhilippinesPolandPortugalPost-demographic dividendPre-demographic dividendPuerto RicoQatarRomaniaRussian FederationRwandaSamoaSan MarinoSao Tome and PrincipeSaudi ArabiaSenegalSerbiaSeychellesSierra LeoneSingaporeSint Maarten (Dutch part)Slovak RepublicSloveniaSmall statesSolomon IslandsSomaliaSouth AfricaSouth AsiaSouth Asia (IDA & IBRD)South SudanSpainSri LankaSt. Kitts and NevisSt. LuciaSt. Martin (French part)St. Vincent and the GrenadinesSub-Saharan Africa Sub-Saharan Africa (excluding high income)Sub-Saharan Africa (IDA & IBRD countries)SudanSurinameSwazilandSwedenSwitzerlandSyrian Arab RepublicTajikistanTanzaniaThailandTimor-LesteTogoTongaTrinidad and TobagoTunisiaTurkeyTurkmenistanTurks and Caicos IslandsTuvaluUgandaUkraineUnited Arab EmiratesUnited KingdomUnited StatesUpper middle incomeUruguayUzbekistanVanuatuVenezuela, RBVietnamVirgin Islands (U.S.)West Bank and GazaWorldYemen, Rep.ZambiaZimbabwe Timeline:
This timeline shows a graph from 1971 to 2009 of Slovenia. No data until 1970. Number of actual observations by date: 39.
Source name:
World Development Indicators
Source organization:
European Commission, Joint Research Centre (JRC)/Netherlands Environmental Assessment Agency (PBL). Emission Database for Global Atmospheric Research (EDGAR): http://edgar.jrc.ec.europa.eu/
Categories, topics:
Agriculture & Rural Development, Environment
Last updated:
apr 23, 2017
Indicators value changes by year
Minimum:
635.828
jan 1, 1997
Maximum:
1.259K
jan 1, 1985
At the date of observation
Value
Absolute change
Change from previous value
jan 1, 1971
882.465
+882.465
0.0%
jan 1, 1972
899.313
+16.848
1.91%
jan 1, 1973
909.886
+10.574
1.18%
jan 1, 1974
925.905
+16.019
1.76%
jan 1, 1975
962.611
+36.705
3.96%
jan 1, 1976
990.417
+27.806
2.89%
jan 1, 1977
1.024K
+33.56
3.39%
jan 1, 1978
1.076K
+52.193
5.1%
jan 1, 1979
1.065K
-11.21
-1.04%
jan 1, 1980
1.068K
+3.482
0.33%
jan 1, 1981
1.049K
-19.021
-1.78%
jan 1, 1982
1.108K
+58.942
5.62%
jan 1, 1983
1.128K
+19.29
1.74%
jan 1, 1984
1.116K
-11.423
-1.01%
jan 1, 1985
1.259K
+143.076
12.82%
jan 1, 1986
1.159K
-100.047
-7.94%
jan 1, 1987
1.105K
-54.422
-4.69%
jan 1, 1988
1.104K
-0.603
-0.05%
jan 1, 1989
1.089K
-15.098
-1.37%
jan 1, 1990
1.033K
-55.8
-5.12%
jan 1, 1991
1.018K
-15.005
-1.45%
jan 1, 1992
814.251
-204.081
-20.04%
jan 1, 1993
774.864
-39.387
-4.84%
jan 1, 1994
708.209
-66.655
-8.6%
jan 1, 1995
663.473
-44.735
-6.32%
jan 1, 1996
697.135
+33.661
5.07%
jan 1, 1997
635.828
-61.307
-8.79%
jan 1, 1998
673.722
+37.894
5.96%
jan 1, 1999
808.843
+135.121
20.06%
jan 1, 2000
843.938
+35.095
4.34%
jan 1, 2001
812.321
-31.617
-3.75%
jan 1, 2002
795.606
-16.715
-2.06%
jan 1, 2003
832.224
+36.617
4.6%
jan 1, 2004
792.198
-40.026
-4.81%
jan 1, 2005
814.704
+22.506
2.84%
jan 1, 2006
813.878
-0.826
-0.1%
jan 1, 2007
817.515
+3.636
0.45%
jan 1, 2008
819.913
+2.398
0.29%
jan 1, 2009
823.94
+4.027
0.49%
Ranking of countries by current statistics by years


Comments: