29
/
en
AIzaSyAYiBZKx7MnpbEhh9jyipgxe19OcubqV5w
April 1, 2024
95772
Burundi
BDI
true
2
1
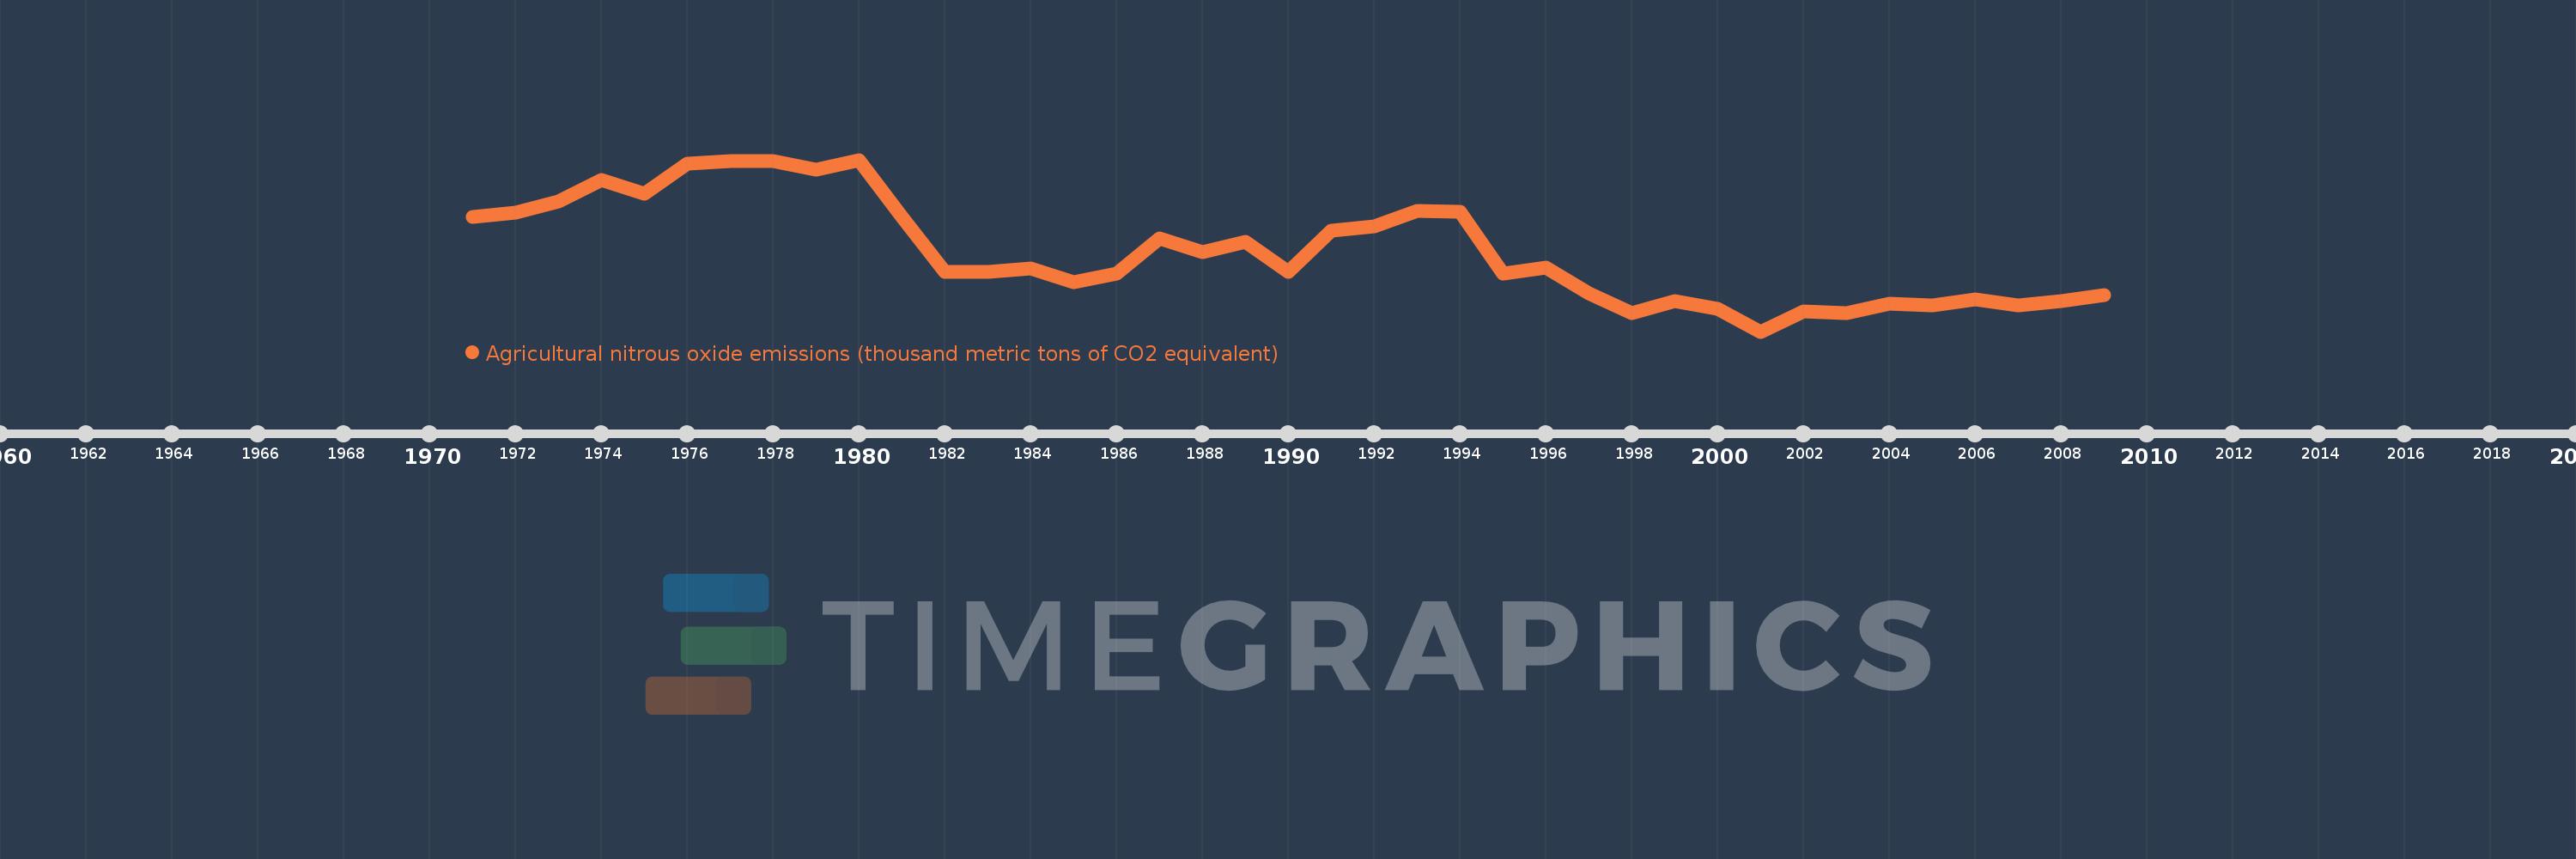
Agricultural nitrous oxide emissions (thousand metric tons of CO2 equivalent)
2009,2008,2007,2006,2005,2004,2003,2002,2001,2000,1999,1998,1997,1996,1995,1994,1993,1992,1991,1990,1989,1988,1987,1986,1985,1984,1983,1982,1981,1980,1979,1978,1977,1976,1975,1974,1973,1972,1971
This statistics in other country:
AfghanistanAlbaniaAlgeriaAmerican SamoaAndorraAngolaAntigua and BarbudaArab WorldArgentinaArmeniaArubaAustraliaAustriaAzerbaijanBahamas, TheBahrainBangladeshBarbadosBelarusBelgiumBelizeBeninBermudaBhutanBoliviaBosnia and HerzegovinaBotswanaBrazilBritish Virgin IslandsBrunei DarussalamBulgariaBurkina FasoBurundiCabo VerdeCambodiaCameroonCanadaCaribbean small statesCayman IslandsCentral African RepublicCentral Europe and the BalticsChadChannel IslandsChileChinaColombiaComorosCongo, Dem. Rep.Congo, Rep.Costa RicaCote d'IvoireCroatiaCubaCuracaoCyprusCzech RepublicDenmarkDjiboutiDominicaDominican RepublicEarly-demographic dividendEast Asia & PacificEast Asia & Pacific (excluding high income)East Asia & Pacific (IDA & IBRD countries)EcuadorEgypt, Arab Rep.El SalvadorEquatorial GuineaEritreaEstoniaEthiopiaEuro areaEurope & Central AsiaEurope & Central Asia (excluding high income)Europe & Central Asia (IDA & IBRD countries)European UnionFaroe IslandsFijiFinlandFragile and conflict affected situationsFranceFrench PolynesiaGabonGambia, TheGeorgiaGermanyGhanaGibraltarGreeceGreenlandGrenadaGuamGuatemalaGuineaGuinea-BissauGuyanaHaitiHeavily indebted poor countries (HIPC)High incomeHondurasHong Kong SAR, ChinaHungaryIBRD onlyIcelandIDA & IBRD totalIDA blendIDA onlyIDA totalIndiaIndonesiaIran, Islamic Rep.IraqIrelandIsle of ManIsraelItalyJamaicaJapanJordanKazakhstanKenyaKiribatiKorea, Dem. People’s Rep.Korea, Rep.KosovoKuwaitKyrgyz RepublicLao PDRLate-demographic dividendLatin America & Caribbean Latin America & Caribbean (excluding high income)Latin America & the Caribbean (IDA & IBRD countries)LatviaLeast developed countries: UN classificationLebanonLesothoLiberiaLibyaLiechtensteinLithuaniaLow & middle incomeLow incomeLower middle incomeLuxembourgMacao SAR, ChinaMacedonia, FYRMadagascarMalawiMalaysiaMaldivesMaliMaltaMarshall IslandsMauritaniaMauritiusMexicoMicronesia, Fed. Sts.Middle East & North AfricaMiddle East & North Africa (excluding high income)Middle East & North Africa (IDA & IBRD countries)Middle incomeMoldovaMonacoMongoliaMontenegroMoroccoMozambiqueMyanmarNamibiaNauruNepalNetherlandsNew CaledoniaNew ZealandNicaraguaNigerNigeriaNorth AmericaNorthern Mariana IslandsNorwayOECD membersOmanOther small statesPacific island small statesPakistanPalauPanamaPapua New GuineaParaguayPeruPhilippinesPolandPortugalPost-demographic dividendPre-demographic dividendPuerto RicoQatarRomaniaRussian FederationRwandaSamoaSan MarinoSao Tome and PrincipeSaudi ArabiaSenegalSerbiaSeychellesSierra LeoneSingaporeSint Maarten (Dutch part)Slovak RepublicSloveniaSmall statesSolomon IslandsSomaliaSouth AfricaSouth AsiaSouth Asia (IDA & IBRD)South SudanSpainSri LankaSt. Kitts and NevisSt. LuciaSt. Martin (French part)St. Vincent and the GrenadinesSub-Saharan Africa Sub-Saharan Africa (excluding high income)Sub-Saharan Africa (IDA & IBRD countries)SudanSurinameSwazilandSwedenSwitzerlandSyrian Arab RepublicTajikistanTanzaniaThailandTimor-LesteTogoTongaTrinidad and TobagoTunisiaTurkeyTurkmenistanTurks and Caicos IslandsTuvaluUgandaUkraineUnited Arab EmiratesUnited KingdomUnited StatesUpper middle incomeUruguayUzbekistanVanuatuVenezuela, RBVietnamVirgin Islands (U.S.)West Bank and GazaWorldYemen, Rep.ZambiaZimbabwe Timeline:
This timeline shows a graph from 1971 to 2009 of Burundi. No data until 1970. Number of actual observations by date: 39.
Source name:
World Development Indicators
Source organization:
European Commission, Joint Research Centre (JRC)/Netherlands Environmental Assessment Agency (PBL). Emission Database for Global Atmospheric Research (EDGAR): http://edgar.jrc.ec.europa.eu/
Categories, topics:
Agriculture & Rural Development, Environment
Last updated:
apr 23, 2017
Indicators value changes by year
Minimum:
352.015
jan 1, 2001
Maximum:
591.098
jan 1, 1980
At the date of observation
Value
Absolute change
Change from previous value
jan 1, 1971
512.185
+512.185
0.0%
jan 1, 1972
517.618
+5.433
1.06%
jan 1, 1973
532.963
+15.346
2.96%
jan 1, 1974
563.451
+30.487
5.72%
jan 1, 1975
543.532
-19.918
-3.54%
jan 1, 1976
585.906
+42.374
7.8%
jan 1, 1977
589.351
+3.445
0.59%
jan 1, 1978
589.462
+0.111
0.02%
jan 1, 1979
577.398
-12.064
-2.05%
jan 1, 1980
591.098
+13.7
2.37%
jan 1, 1981
511.209
-79.889
-13.52%
jan 1, 1982
434.648
-76.561
-14.98%
jan 1, 1983
435.611
+0.964
0.22%
jan 1, 1984
439.283
+3.672
0.84%
jan 1, 1985
421.006
-18.277
-4.16%
jan 1, 1986
432.141
+11.135
2.64%
jan 1, 1987
481.314
+49.173
11.38%
jan 1, 1988
462.056
-19.258
-4.0%
jan 1, 1989
477.342
+15.286
3.31%
jan 1, 1990
434.943
-42.398
-8.88%
jan 1, 1991
492.187
+57.243
13.16%
jan 1, 1992
497.942
+5.755
1.17%
jan 1, 1993
520.484
+22.542
4.53%
jan 1, 1994
518.327
-2.158
-0.41%
jan 1, 1995
432.626
-85.7
-16.53%
jan 1, 1996
440.554
+7.927
1.83%
jan 1, 1997
405.127
-35.427
-8.04%
jan 1, 1998
378.09
-27.037
-6.67%
jan 1, 1999
394.022
+15.932
4.21%
jan 1, 2000
383.38
-10.641
-2.7%
jan 1, 2001
352.015
-31.365
-8.18%
jan 1, 2002
380.03
+28.014
7.96%
jan 1, 2003
377.271
-2.759
-0.73%
jan 1, 2004
390.755
+13.484
3.57%
jan 1, 2005
388.156
-2.599
-0.67%
jan 1, 2006
396.813
+8.658
2.23%
jan 1, 2007
388.127
-8.686
-2.19%
jan 1, 2008
394.937
+6.81
1.75%
jan 1, 2009
403.061
+8.124
2.06%
Ranking of countries by current statistics by years


Comments: