29
/
en
AIzaSyAYiBZKx7MnpbEhh9jyipgxe19OcubqV5w
April 1, 2024
234384
Saudi Arabia
SAU
true
2
1
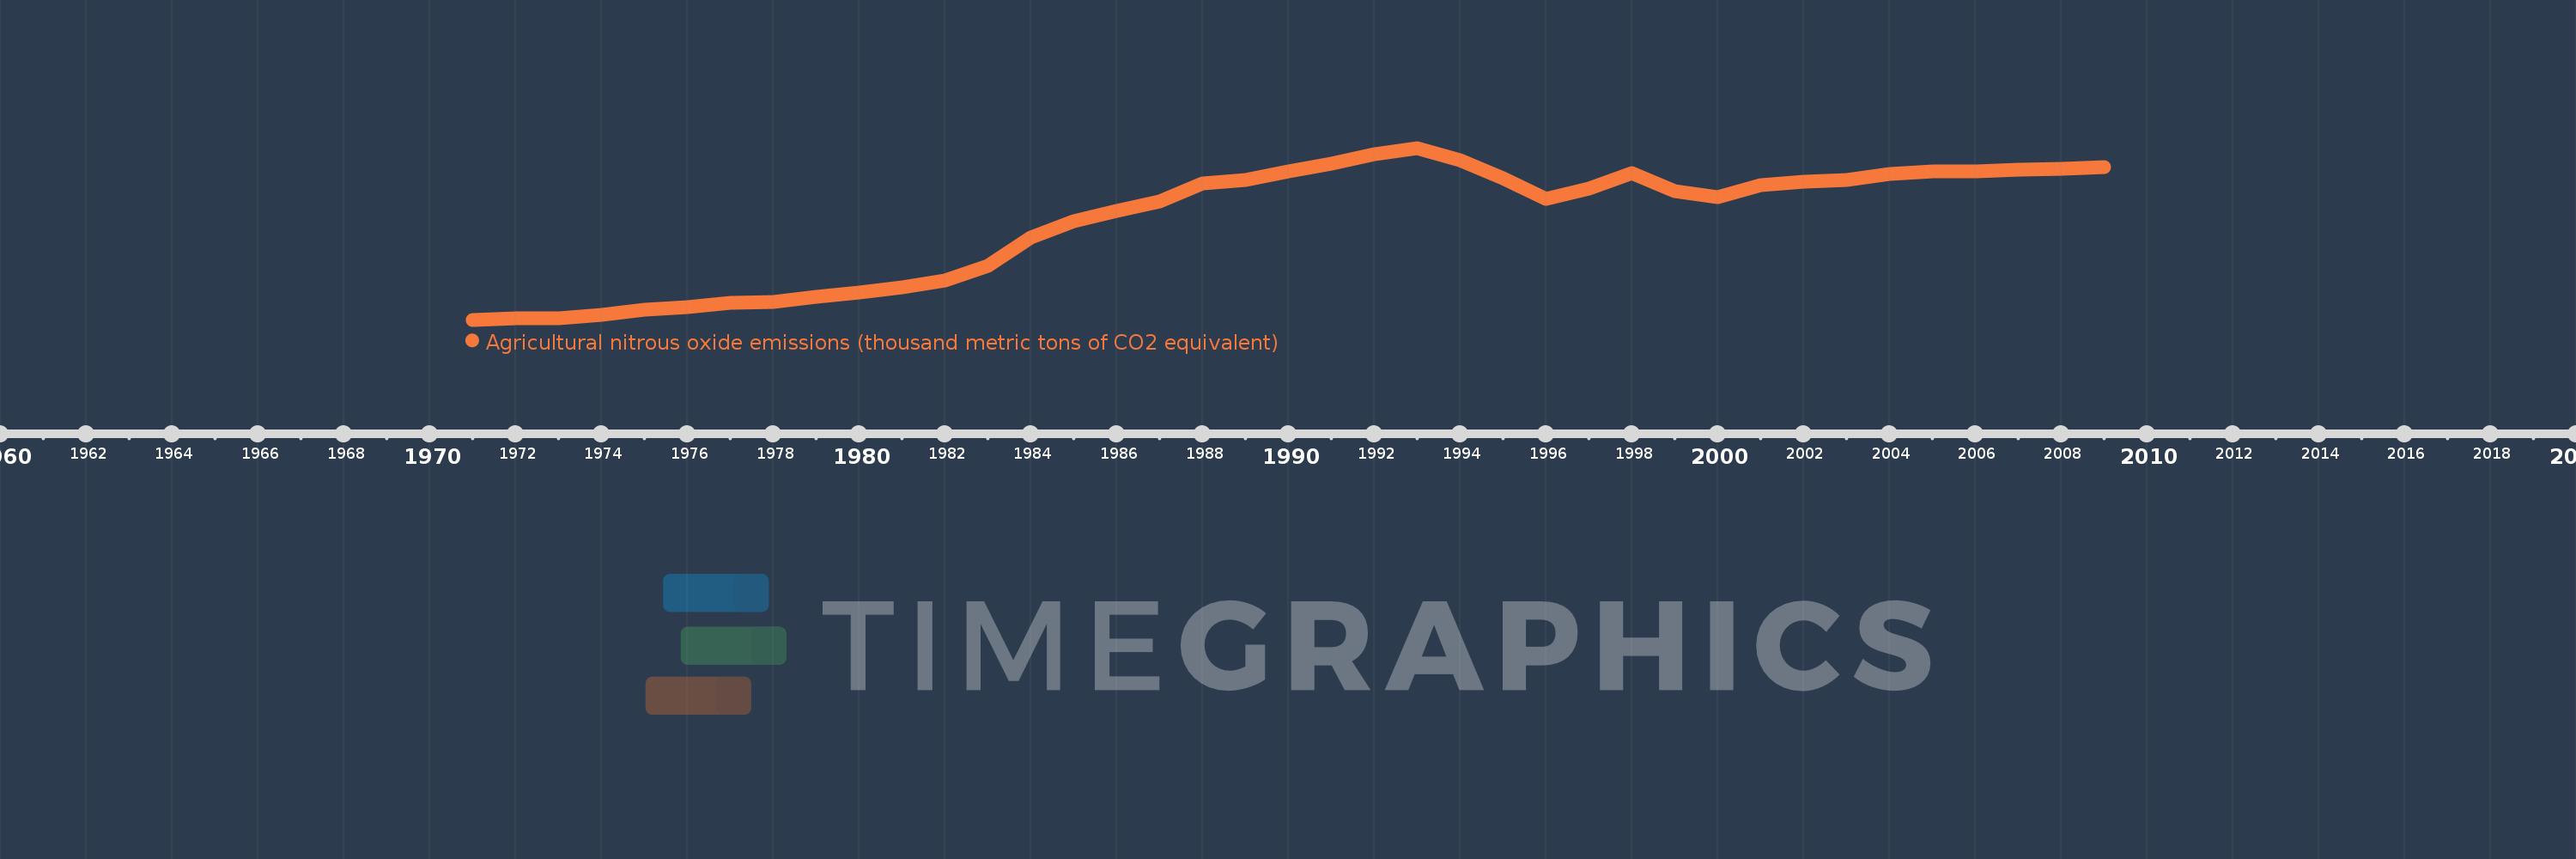
Agricultural nitrous oxide emissions (thousand metric tons of CO2 equivalent)
2009,2008,2007,2006,2005,2004,2003,2002,2001,2000,1999,1998,1997,1996,1995,1994,1993,1992,1991,1990,1989,1988,1987,1986,1985,1984,1983,1982,1981,1980,1979,1978,1977,1976,1975,1974,1973,1972,1971
This statistics in other country:
AfghanistanAlbaniaAlgeriaAmerican SamoaAndorraAngolaAntigua and BarbudaArab WorldArgentinaArmeniaArubaAustraliaAustriaAzerbaijanBahamas, TheBahrainBangladeshBarbadosBelarusBelgiumBelizeBeninBermudaBhutanBoliviaBosnia and HerzegovinaBotswanaBrazilBritish Virgin IslandsBrunei DarussalamBulgariaBurkina FasoBurundiCabo VerdeCambodiaCameroonCanadaCaribbean small statesCayman IslandsCentral African RepublicCentral Europe and the BalticsChadChannel IslandsChileChinaColombiaComorosCongo, Dem. Rep.Congo, Rep.Costa RicaCote d'IvoireCroatiaCubaCuracaoCyprusCzech RepublicDenmarkDjiboutiDominicaDominican RepublicEarly-demographic dividendEast Asia & PacificEast Asia & Pacific (excluding high income)East Asia & Pacific (IDA & IBRD countries)EcuadorEgypt, Arab Rep.El SalvadorEquatorial GuineaEritreaEstoniaEthiopiaEuro areaEurope & Central AsiaEurope & Central Asia (excluding high income)Europe & Central Asia (IDA & IBRD countries)European UnionFaroe IslandsFijiFinlandFragile and conflict affected situationsFranceFrench PolynesiaGabonGambia, TheGeorgiaGermanyGhanaGibraltarGreeceGreenlandGrenadaGuamGuatemalaGuineaGuinea-BissauGuyanaHaitiHeavily indebted poor countries (HIPC)High incomeHondurasHong Kong SAR, ChinaHungaryIBRD onlyIcelandIDA & IBRD totalIDA blendIDA onlyIDA totalIndiaIndonesiaIran, Islamic Rep.IraqIrelandIsle of ManIsraelItalyJamaicaJapanJordanKazakhstanKenyaKiribatiKorea, Dem. People’s Rep.Korea, Rep.KosovoKuwaitKyrgyz RepublicLao PDRLate-demographic dividendLatin America & Caribbean Latin America & Caribbean (excluding high income)Latin America & the Caribbean (IDA & IBRD countries)LatviaLeast developed countries: UN classificationLebanonLesothoLiberiaLibyaLiechtensteinLithuaniaLow & middle incomeLow incomeLower middle incomeLuxembourgMacao SAR, ChinaMacedonia, FYRMadagascarMalawiMalaysiaMaldivesMaliMaltaMarshall IslandsMauritaniaMauritiusMexicoMicronesia, Fed. Sts.Middle East & North AfricaMiddle East & North Africa (excluding high income)Middle East & North Africa (IDA & IBRD countries)Middle incomeMoldovaMonacoMongoliaMontenegroMoroccoMozambiqueMyanmarNamibiaNauruNepalNetherlandsNew CaledoniaNew ZealandNicaraguaNigerNigeriaNorth AmericaNorthern Mariana IslandsNorwayOECD membersOmanOther small statesPacific island small statesPakistanPalauPanamaPapua New GuineaParaguayPeruPhilippinesPolandPortugalPost-demographic dividendPre-demographic dividendPuerto RicoQatarRomaniaRussian FederationRwandaSamoaSan MarinoSao Tome and PrincipeSaudi ArabiaSenegalSerbiaSeychellesSierra LeoneSingaporeSint Maarten (Dutch part)Slovak RepublicSloveniaSmall statesSolomon IslandsSomaliaSouth AfricaSouth AsiaSouth Asia (IDA & IBRD)South SudanSpainSri LankaSt. Kitts and NevisSt. LuciaSt. Martin (French part)St. Vincent and the GrenadinesSub-Saharan Africa Sub-Saharan Africa (excluding high income)Sub-Saharan Africa (IDA & IBRD countries)SudanSurinameSwazilandSwedenSwitzerlandSyrian Arab RepublicTajikistanTanzaniaThailandTimor-LesteTogoTongaTrinidad and TobagoTunisiaTurkeyTurkmenistanTurks and Caicos IslandsTuvaluUgandaUkraineUnited Arab EmiratesUnited KingdomUnited StatesUpper middle incomeUruguayUzbekistanVanuatuVenezuela, RBVietnamVirgin Islands (U.S.)West Bank and GazaWorldYemen, Rep.ZambiaZimbabwe Timeline:
This timeline shows a graph from 1971 to 2009 of Saudi Arabia. No data until 1970. Number of actual observations by date: 39.
Source name:
World Development Indicators
Source organization:
European Commission, Joint Research Centre (JRC)/Netherlands Environmental Assessment Agency (PBL). Emission Database for Global Atmospheric Research (EDGAR): http://edgar.jrc.ec.europa.eu/
Categories, topics:
Agriculture & Rural Development, Environment
Last updated:
apr 23, 2017
Indicators value changes by year
Minimum:
400.35
jan 1, 1971
Maximum:
3.399K
jan 1, 1993
At the date of observation
Value
Absolute change
Change from previous value
jan 1, 1971
400.35
+400.35
0.0%
jan 1, 1972
419.411
+19.062
4.76%
jan 1, 1973
425.449
+6.038
1.44%
jan 1, 1974
491.547
+66.098
15.54%
jan 1, 1975
568.324
+76.777
15.62%
jan 1, 1976
621.024
+52.699
9.27%
jan 1, 1977
692.138
+71.114
11.45%
jan 1, 1978
717.094
+24.956
3.61%
jan 1, 1979
803.593
+86.499
12.06%
jan 1, 1980
879.397
+75.804
9.43%
jan 1, 1981
960.255
+80.859
9.19%
jan 1, 1982
1.089K
+128.776
13.41%
jan 1, 1983
1.34K
+250.855
23.03%
jan 1, 1984
1.831K
+491.569
36.69%
jan 1, 1985
2.119K
+288.022
15.73%
jan 1, 1986
2.3K
+180.053
8.5%
jan 1, 1987
2.468K
+168.873
7.34%
jan 1, 1988
2.785K
+317.034
12.84%
jan 1, 1989
2.836K
+50.145
1.8%
jan 1, 1990
2.987K
+151.113
5.33%
jan 1, 1991
3.127K
+140.173
4.69%
jan 1, 1992
3.284K
+157.17
5.03%
jan 1, 1993
3.399K
+114.959
3.5%
jan 1, 1994
3.186K
-212.527
-6.25%
jan 1, 1995
2.872K
-313.99
-9.85%
jan 1, 1996
2.514K
-358.083
-12.47%
jan 1, 1997
2.694K
+179.392
7.13%
jan 1, 1998
2.959K
+265.369
9.85%
jan 1, 1999
2.643K
-316.659
-10.7%
jan 1, 2000
2.537K
-105.398
-3.99%
jan 1, 2001
2.751K
+213.452
8.41%
jan 1, 2002
2.817K
+66.197
2.41%
jan 1, 2003
2.847K
+30.285
1.08%
jan 1, 2004
2.944K
+97.195
3.41%
jan 1, 2005
2.993K
+48.487
1.65%
jan 1, 2006
2.996K
+3.57
0.12%
jan 1, 2007
3.021K
+24.435
0.82%
jan 1, 2008
3.038K
+17.507
0.58%
jan 1, 2009
3.059K
+21.181
0.7%
Ranking of countries by current statistics by years


Comments: