29
/
en
AIzaSyAYiBZKx7MnpbEhh9jyipgxe19OcubqV5w
April 1, 2024
142489
Greenland
GRL
true
2
1
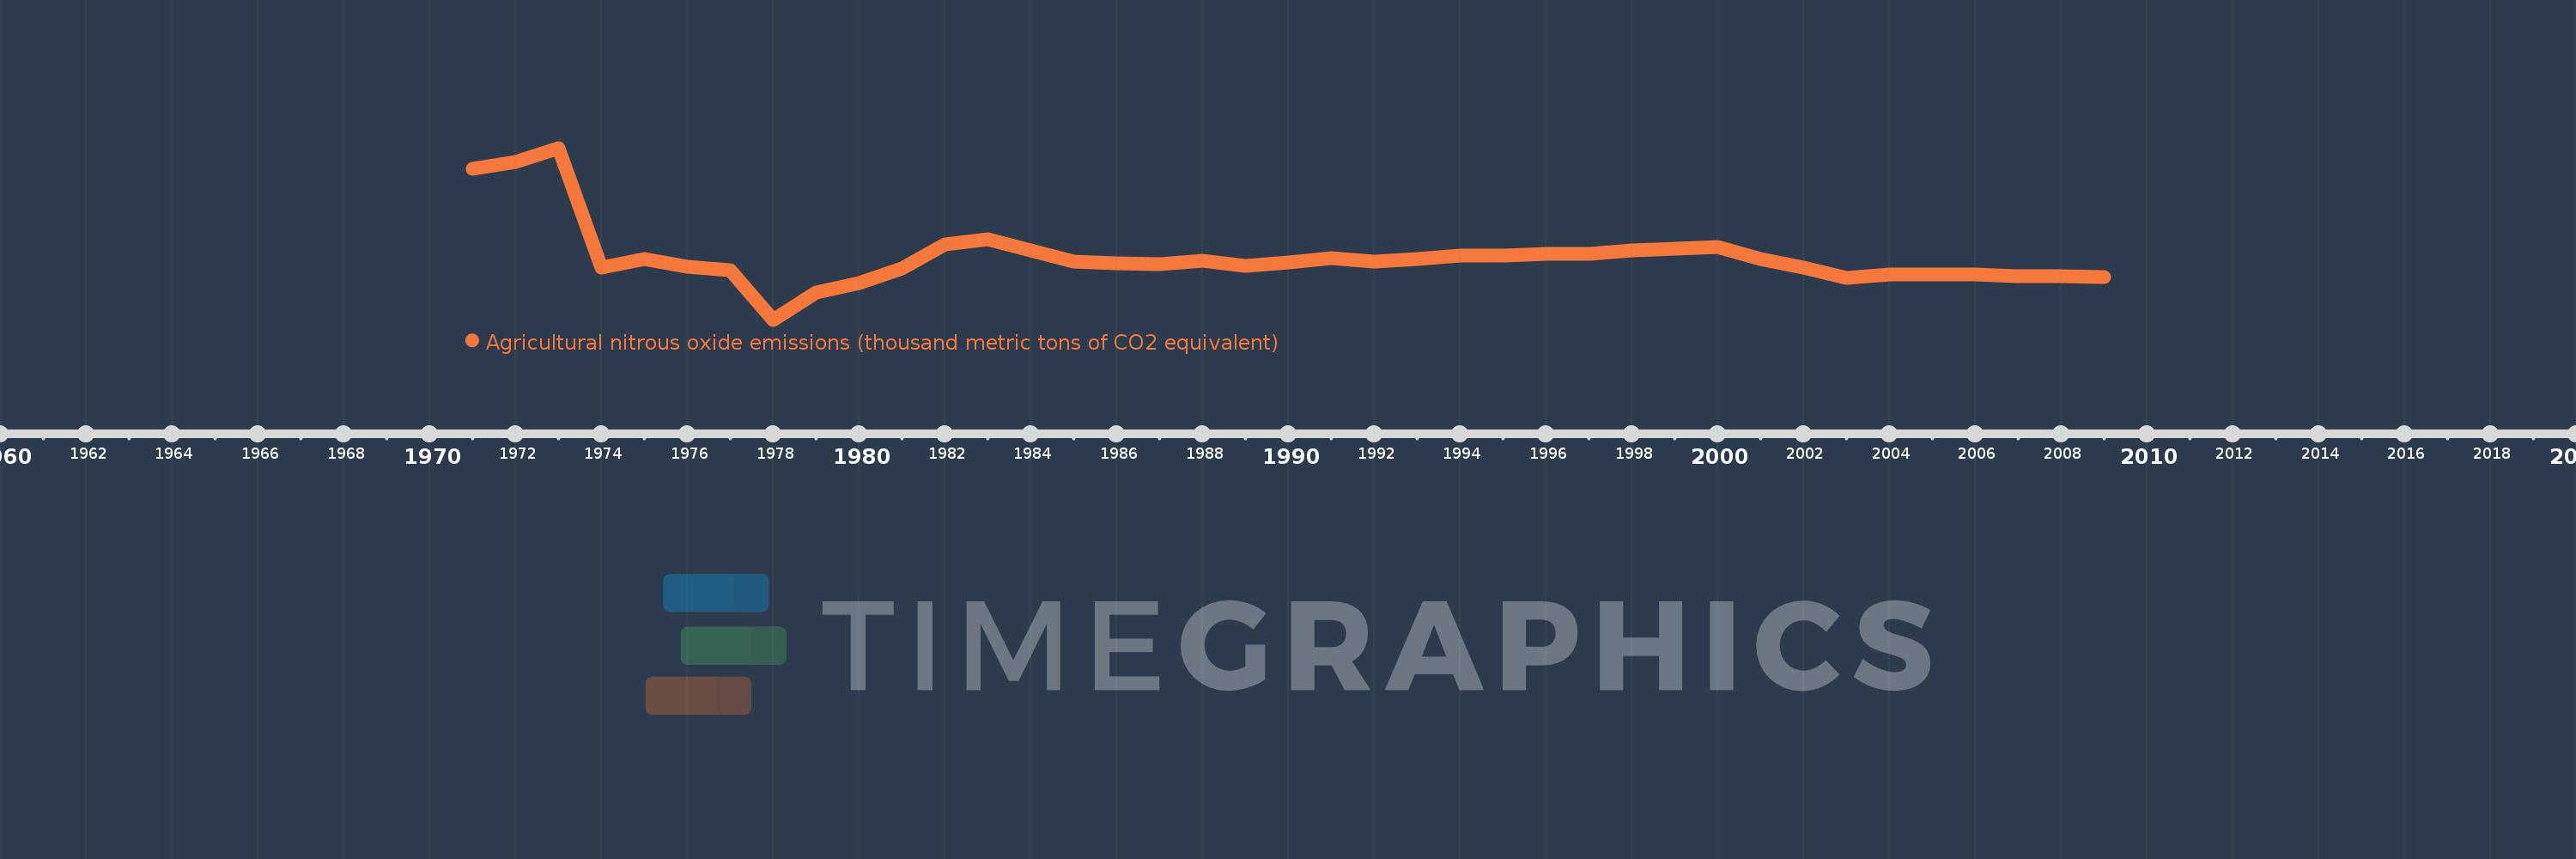
Agricultural nitrous oxide emissions (thousand metric tons of CO2 equivalent)
2009,2008,2007,2006,2005,2004,2003,2002,2001,2000,1999,1998,1997,1996,1995,1994,1993,1992,1991,1990,1989,1988,1987,1986,1985,1984,1983,1982,1981,1980,1979,1978,1977,1976,1975,1974,1973,1972,1971
This statistics in other country:
AfghanistanAlbaniaAlgeriaAmerican SamoaAndorraAngolaAntigua and BarbudaArab WorldArgentinaArmeniaArubaAustraliaAustriaAzerbaijanBahamas, TheBahrainBangladeshBarbadosBelarusBelgiumBelizeBeninBermudaBhutanBoliviaBosnia and HerzegovinaBotswanaBrazilBritish Virgin IslandsBrunei DarussalamBulgariaBurkina FasoBurundiCabo VerdeCambodiaCameroonCanadaCaribbean small statesCayman IslandsCentral African RepublicCentral Europe and the BalticsChadChannel IslandsChileChinaColombiaComorosCongo, Dem. Rep.Congo, Rep.Costa RicaCote d'IvoireCroatiaCubaCuracaoCyprusCzech RepublicDenmarkDjiboutiDominicaDominican RepublicEarly-demographic dividendEast Asia & PacificEast Asia & Pacific (excluding high income)East Asia & Pacific (IDA & IBRD countries)EcuadorEgypt, Arab Rep.El SalvadorEquatorial GuineaEritreaEstoniaEthiopiaEuro areaEurope & Central AsiaEurope & Central Asia (excluding high income)Europe & Central Asia (IDA & IBRD countries)European UnionFaroe IslandsFijiFinlandFragile and conflict affected situationsFranceFrench PolynesiaGabonGambia, TheGeorgiaGermanyGhanaGibraltarGreeceGreenlandGrenadaGuamGuatemalaGuineaGuinea-BissauGuyanaHaitiHeavily indebted poor countries (HIPC)High incomeHondurasHong Kong SAR, ChinaHungaryIBRD onlyIcelandIDA & IBRD totalIDA blendIDA onlyIDA totalIndiaIndonesiaIran, Islamic Rep.IraqIrelandIsle of ManIsraelItalyJamaicaJapanJordanKazakhstanKenyaKiribatiKorea, Dem. People’s Rep.Korea, Rep.KosovoKuwaitKyrgyz RepublicLao PDRLate-demographic dividendLatin America & Caribbean Latin America & Caribbean (excluding high income)Latin America & the Caribbean (IDA & IBRD countries)LatviaLeast developed countries: UN classificationLebanonLesothoLiberiaLibyaLiechtensteinLithuaniaLow & middle incomeLow incomeLower middle incomeLuxembourgMacao SAR, ChinaMacedonia, FYRMadagascarMalawiMalaysiaMaldivesMaliMaltaMarshall IslandsMauritaniaMauritiusMexicoMicronesia, Fed. Sts.Middle East & North AfricaMiddle East & North Africa (excluding high income)Middle East & North Africa (IDA & IBRD countries)Middle incomeMoldovaMonacoMongoliaMontenegroMoroccoMozambiqueMyanmarNamibiaNauruNepalNetherlandsNew CaledoniaNew ZealandNicaraguaNigerNigeriaNorth AmericaNorthern Mariana IslandsNorwayOECD membersOmanOther small statesPacific island small statesPakistanPalauPanamaPapua New GuineaParaguayPeruPhilippinesPolandPortugalPost-demographic dividendPre-demographic dividendPuerto RicoQatarRomaniaRussian FederationRwandaSamoaSan MarinoSao Tome and PrincipeSaudi ArabiaSenegalSerbiaSeychellesSierra LeoneSingaporeSint Maarten (Dutch part)Slovak RepublicSloveniaSmall statesSolomon IslandsSomaliaSouth AfricaSouth AsiaSouth Asia (IDA & IBRD)South SudanSpainSri LankaSt. Kitts and NevisSt. LuciaSt. Martin (French part)St. Vincent and the GrenadinesSub-Saharan Africa Sub-Saharan Africa (excluding high income)Sub-Saharan Africa (IDA & IBRD countries)SudanSurinameSwazilandSwedenSwitzerlandSyrian Arab RepublicTajikistanTanzaniaThailandTimor-LesteTogoTongaTrinidad and TobagoTunisiaTurkeyTurkmenistanTurks and Caicos IslandsTuvaluUgandaUkraineUnited Arab EmiratesUnited KingdomUnited StatesUpper middle incomeUruguayUzbekistanVanuatuVenezuela, RBVietnamVirgin Islands (U.S.)West Bank and GazaWorldYemen, Rep.ZambiaZimbabwe Timeline:
This timeline shows a graph from 1971 to 2009 of Greenland. No data until 1970. Number of actual observations by date: 39.
Source name:
World Development Indicators
Source organization:
European Commission, Joint Research Centre (JRC)/Netherlands Environmental Assessment Agency (PBL). Emission Database for Global Atmospheric Research (EDGAR): http://edgar.jrc.ec.europa.eu/
Categories, topics:
Agriculture & Rural Development, Environment
Last updated:
apr 23, 2017
Indicators value changes by year
At the date of observation
Value
Absolute change
Change from previous value
jan 1, 1971
2.339
+2.339
0.0%
jan 1, 1972
2.4
+0.061
2.62%
jan 1, 1973
2.513
+0.112
4.68%
jan 1, 1974
1.522
-0.991
-39.44%
jan 1, 1975
1.591
+0.069
4.53%
jan 1, 1976
1.53
-0.06
-3.79%
jan 1, 1977
1.5
-0.031
-2.01%
jan 1, 1978
1.088
-0.411
-27.43%
jan 1, 1979
1.312
+0.224
20.57%
jan 1, 1980
1.389
+0.077
5.87%
jan 1, 1981
1.512
+0.122
8.81%
jan 1, 1982
1.716
+0.204
13.51%
jan 1, 1983
1.755
+0.039
2.26%
jan 1, 1984
1.665
-0.09
-5.11%
jan 1, 1985
1.572
-0.093
-5.57%
jan 1, 1986
1.558
-0.014
-0.89%
jan 1, 1987
1.552
-0.006
-0.38%
jan 1, 1988
1.575
+0.023
1.45%
jan 1, 1989
1.537
-0.038
-2.43%
jan 1, 1990
1.565
+0.029
1.88%
jan 1, 1991
1.601
+0.035
2.24%
jan 1, 1992
1.572
-0.028
-1.75%
jan 1, 1993
1.589
+0.016
1.04%
jan 1, 1994
1.618
+0.029
1.83%
jan 1, 1995
1.619
+0.001
0.04%
jan 1, 1996
1.632
+0.014
0.83%
jan 1, 1997
1.633
+0.001
0.05%
jan 1, 1998
1.661
+0.028
1.7%
jan 1, 1999
1.675
+0.014
0.84%
jan 1, 2000
1.693
+0.018
1.09%
jan 1, 2001
1.589
-0.104
-6.14%
jan 1, 2002
1.523
-0.066
-4.14%
jan 1, 2003
1.435
-0.088
-5.77%
jan 1, 2004
1.467
+0.032
2.22%
jan 1, 2005
1.461
-0.007
-0.45%
jan 1, 2006
1.461
+0.0
0.0%
jan 1, 2007
1.451
-0.009
-0.64%
jan 1, 2008
1.447
-0.005
-0.32%
jan 1, 2009
1.44
-0.007
-0.48%
Ranking of countries by current statistics by years


Comments: