29
/
en
AIzaSyAYiBZKx7MnpbEhh9jyipgxe19OcubqV5w
April 1, 2024
60547
Sub-Saharan Africa (IDA & IBRD countries)
TSS
false
2
1
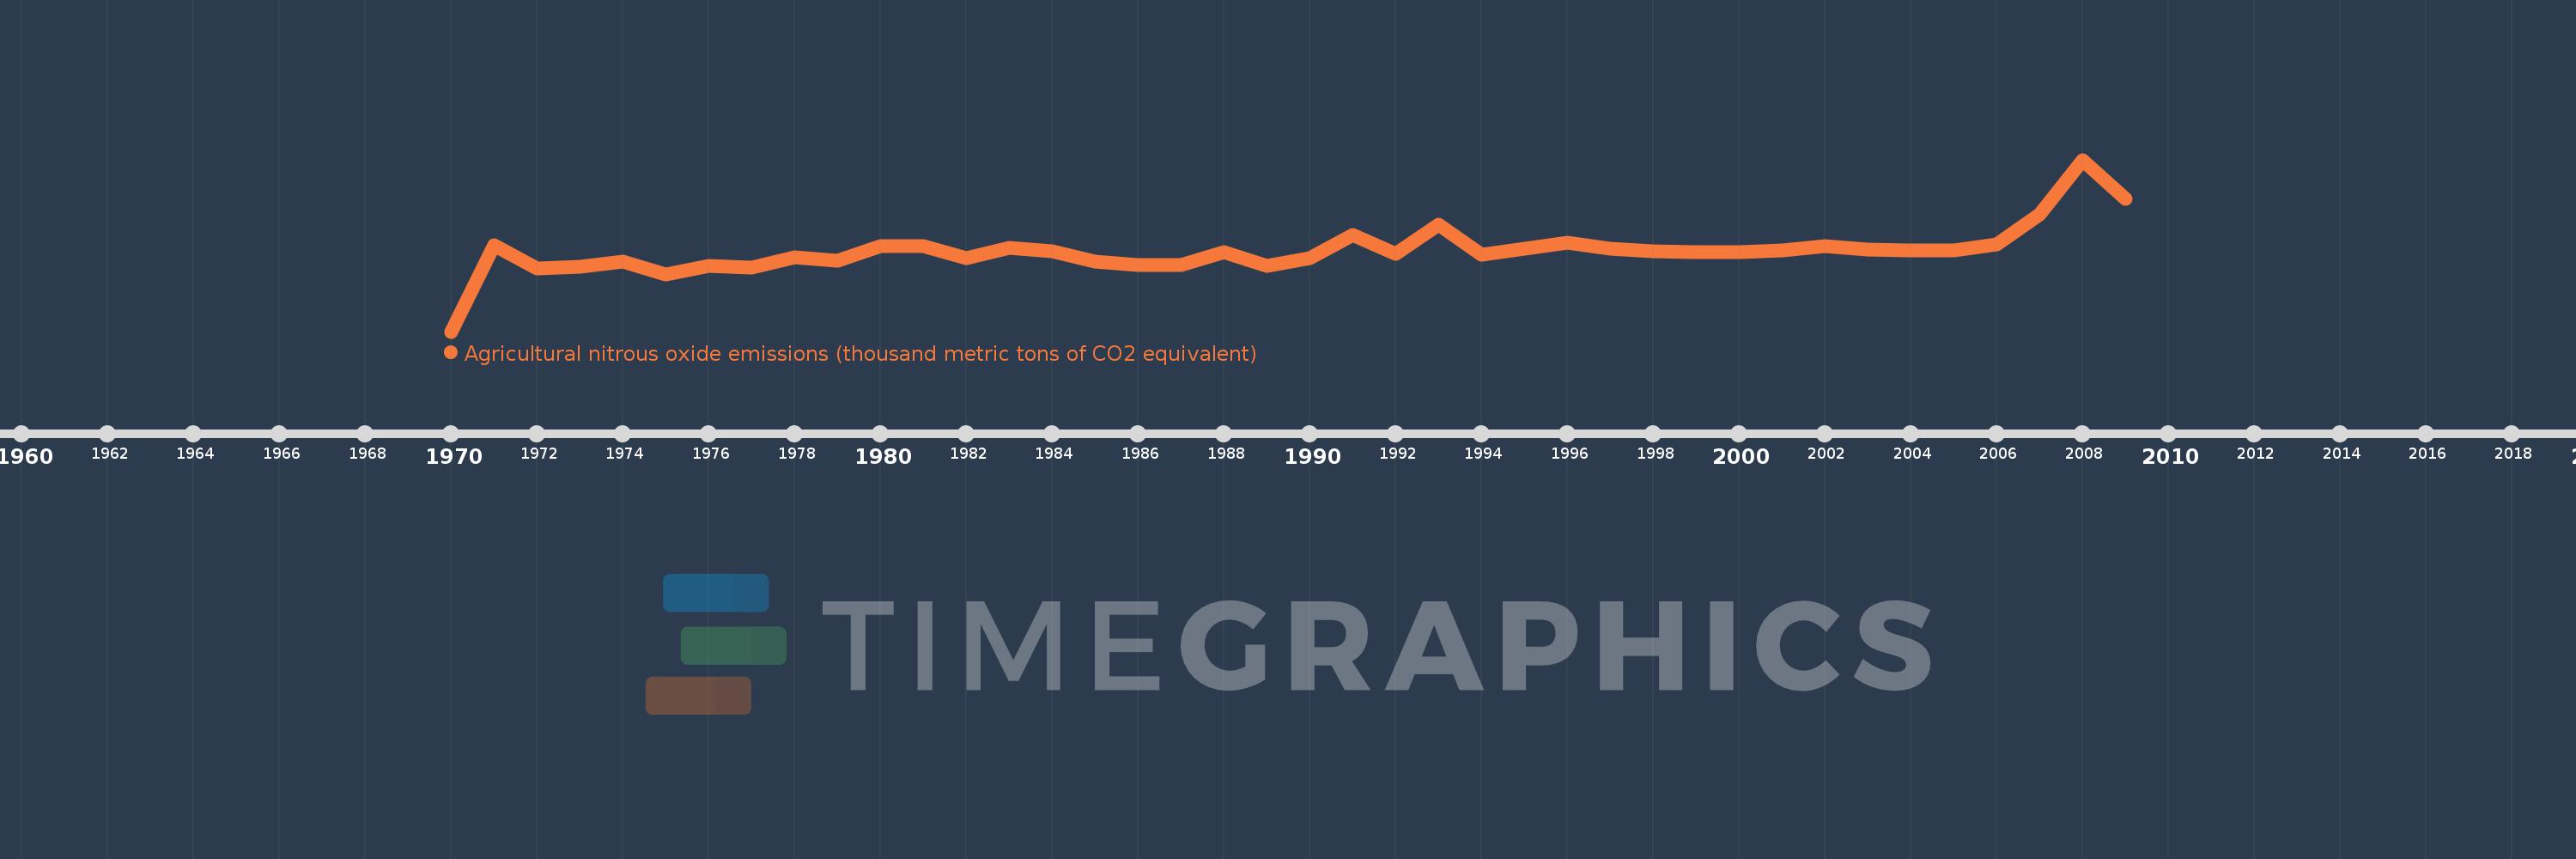
Agricultural nitrous oxide emissions (thousand metric tons of CO2 equivalent)
2009,2008,2007,2006,2005,2004,2003,2002,2001,2000,1999,1998,1997,1996,1995,1994,1993,1992,1991,1990,1989,1988,1987,1986,1985,1984,1983,1982,1981,1980,1979,1978,1977,1976,1975,1974,1973,1972,1971,1970
This statistics in other country:
AfghanistanAlbaniaAlgeriaAmerican SamoaAndorraAngolaAntigua and BarbudaArab WorldArgentinaArmeniaArubaAustraliaAustriaAzerbaijanBahamas, TheBahrainBangladeshBarbadosBelarusBelgiumBelizeBeninBermudaBhutanBoliviaBosnia and HerzegovinaBotswanaBrazilBritish Virgin IslandsBrunei DarussalamBulgariaBurkina FasoBurundiCabo VerdeCambodiaCameroonCanadaCaribbean small statesCayman IslandsCentral African RepublicCentral Europe and the BalticsChadChannel IslandsChileChinaColombiaComorosCongo, Dem. Rep.Congo, Rep.Costa RicaCote d'IvoireCroatiaCubaCuracaoCyprusCzech RepublicDenmarkDjiboutiDominicaDominican RepublicEarly-demographic dividendEast Asia & PacificEast Asia & Pacific (excluding high income)East Asia & Pacific (IDA & IBRD countries)EcuadorEgypt, Arab Rep.El SalvadorEquatorial GuineaEritreaEstoniaEthiopiaEuro areaEurope & Central AsiaEurope & Central Asia (excluding high income)Europe & Central Asia (IDA & IBRD countries)European UnionFaroe IslandsFijiFinlandFragile and conflict affected situationsFranceFrench PolynesiaGabonGambia, TheGeorgiaGermanyGhanaGibraltarGreeceGreenlandGrenadaGuamGuatemalaGuineaGuinea-BissauGuyanaHaitiHeavily indebted poor countries (HIPC)High incomeHondurasHong Kong SAR, ChinaHungaryIBRD onlyIcelandIDA & IBRD totalIDA blendIDA onlyIDA totalIndiaIndonesiaIran, Islamic Rep.IraqIrelandIsle of ManIsraelItalyJamaicaJapanJordanKazakhstanKenyaKiribatiKorea, Dem. People’s Rep.Korea, Rep.KosovoKuwaitKyrgyz RepublicLao PDRLate-demographic dividendLatin America & Caribbean Latin America & Caribbean (excluding high income)Latin America & the Caribbean (IDA & IBRD countries)LatviaLeast developed countries: UN classificationLebanonLesothoLiberiaLibyaLiechtensteinLithuaniaLow & middle incomeLow incomeLower middle incomeLuxembourgMacao SAR, ChinaMacedonia, FYRMadagascarMalawiMalaysiaMaldivesMaliMaltaMarshall IslandsMauritaniaMauritiusMexicoMicronesia, Fed. Sts.Middle East & North AfricaMiddle East & North Africa (excluding high income)Middle East & North Africa (IDA & IBRD countries)Middle incomeMoldovaMonacoMongoliaMontenegroMoroccoMozambiqueMyanmarNamibiaNauruNepalNetherlandsNew CaledoniaNew ZealandNicaraguaNigerNigeriaNorth AmericaNorthern Mariana IslandsNorwayOECD membersOmanOther small statesPacific island small statesPakistanPalauPanamaPapua New GuineaParaguayPeruPhilippinesPolandPortugalPost-demographic dividendPre-demographic dividendPuerto RicoQatarRomaniaRussian FederationRwandaSamoaSan MarinoSao Tome and PrincipeSaudi ArabiaSenegalSerbiaSeychellesSierra LeoneSingaporeSint Maarten (Dutch part)Slovak RepublicSloveniaSmall statesSolomon IslandsSomaliaSouth AfricaSouth AsiaSouth Asia (IDA & IBRD)South SudanSpainSri LankaSt. Kitts and NevisSt. LuciaSt. Martin (French part)St. Vincent and the GrenadinesSub-Saharan Africa Sub-Saharan Africa (excluding high income)Sub-Saharan Africa (IDA & IBRD countries)SudanSurinameSwazilandSwedenSwitzerlandSyrian Arab RepublicTajikistanTanzaniaThailandTimor-LesteTogoTongaTrinidad and TobagoTunisiaTurkeyTurkmenistanTurks and Caicos IslandsTuvaluUgandaUkraineUnited Arab EmiratesUnited KingdomUnited StatesUpper middle incomeUruguayUzbekistanVanuatuVenezuela, RBVietnamVirgin Islands (U.S.)West Bank and GazaWorldYemen, Rep.ZambiaZimbabwe Timeline:
This timeline shows a graph from 1970 to 2009 of Sub-Saharan Africa (IDA & IBRD countries). No data until 1969. Number of actual observations by date: 40.
Source name:
World Development Indicators
Source organization:
European Commission, Joint Research Centre (JRC)/Netherlands Environmental Assessment Agency (PBL). Emission Database for Global Atmospheric Research (EDGAR): http://edgar.jrc.ec.europa.eu/
Categories, topics:
Agriculture & Rural Development, Environment
Last updated:
apr 23, 2017
Indicators value changes by year
Maximum:
557.084K
jan 1, 2008
At the date of observation
Value
Absolute change
Change from previous value
jan 1, 1971
280.493K
+280.493K
%
jan 1, 1972
203.879K
-76.614K
-27.31%
jan 1, 1973
210.378K
+6.499K
3.19%
jan 1, 1974
225.717K
+15.339K
7.29%
jan 1, 1975
186.195K
-39.522K
-17.51%
jan 1, 1976
213.493K
+27.298K
14.66%
jan 1, 1977
206.185K
-7.309K
-3.42%
jan 1, 1978
240.172K
+33.988K
16.48%
jan 1, 1979
229.453K
-10.719K
-4.46%
jan 1, 1980
278.541K
+49.088K
21.39%
jan 1, 1981
277.871K
-670.718
-0.24%
jan 1, 1982
237.951K
-39.92K
-14.37%
jan 1, 1983
271.611K
+33.661K
14.15%
jan 1, 1984
259.807K
-11.805K
-4.35%
jan 1, 1985
226.592K
-33.215K
-12.78%
jan 1, 1986
216.815K
-9.777K
-4.31%
jan 1, 1987
216.397K
-418.272
-0.19%
jan 1, 1988
258.004K
+41.607K
19.23%
jan 1, 1989
212.025K
-45.979K
-17.82%
jan 1, 1990
238.047K
+26.022K
12.27%
jan 1, 1991
312.704K
+74.657K
31.36%
jan 1, 1992
253.169K
-59.535K
-19.04%
jan 1, 1993
347.895K
+94.726K
37.42%
jan 1, 1994
249.426K
-98.469K
-28.3%
jan 1, 1995
268.826K
+19.4K
7.78%
jan 1, 1996
288.527K
+19.7K
7.33%
jan 1, 1997
268.673K
-19.853K
-6.88%
jan 1, 1998
261.737K
-6.936K
-2.58%
jan 1, 1999
257.833K
-3.904K
-1.49%
jan 1, 2000
256.619K
-1.215K
-0.47%
jan 1, 2001
263.578K
+6.96K
2.71%
jan 1, 2002
278.224K
+14.645K
5.56%
jan 1, 2003
264.836K
-13.388K
-4.81%
jan 1, 2004
261.964K
-2.871K
-1.08%
jan 1, 2005
263.476K
+1.512K
0.58%
jan 1, 2006
281.418K
+17.942K
6.81%
jan 1, 2007
380.59K
+99.172K
35.24%
jan 1, 2008
557.084K
+176.494K
46.37%
jan 1, 2009
430.794K
-126.29K
-22.67%
Ranking of countries by current statistics by years


Comments: