29
/
en
AIzaSyAYiBZKx7MnpbEhh9jyipgxe19OcubqV5w
April 1, 2024
229413
Russian Federation
RUS
true
2
1
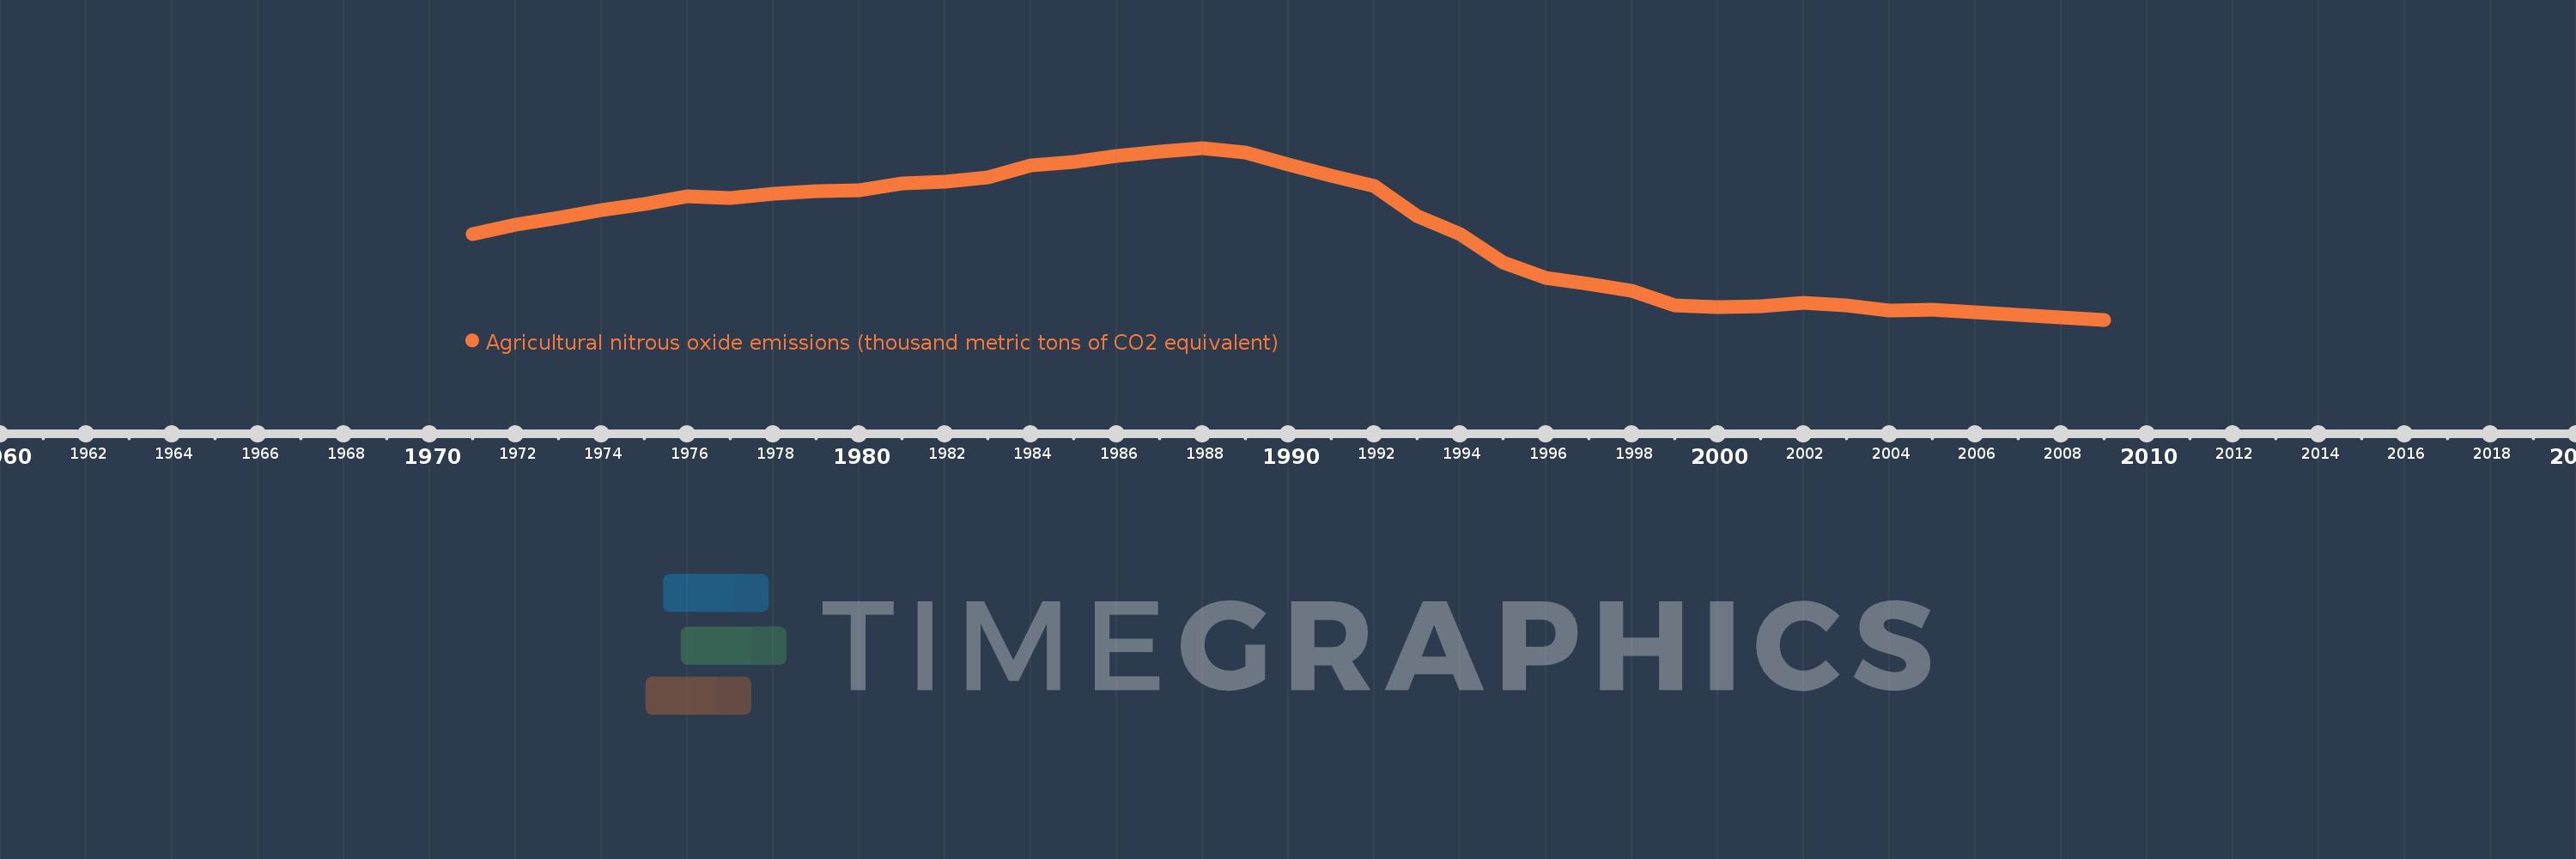
Agricultural nitrous oxide emissions (thousand metric tons of CO2 equivalent)
2009,2008,2007,2006,2005,2004,2003,2002,2001,2000,1999,1998,1997,1996,1995,1994,1993,1992,1991,1990,1989,1988,1987,1986,1985,1984,1983,1982,1981,1980,1979,1978,1977,1976,1975,1974,1973,1972,1971
This statistics in other country:
AfghanistanAlbaniaAlgeriaAmerican SamoaAndorraAngolaAntigua and BarbudaArab WorldArgentinaArmeniaArubaAustraliaAustriaAzerbaijanBahamas, TheBahrainBangladeshBarbadosBelarusBelgiumBelizeBeninBermudaBhutanBoliviaBosnia and HerzegovinaBotswanaBrazilBritish Virgin IslandsBrunei DarussalamBulgariaBurkina FasoBurundiCabo VerdeCambodiaCameroonCanadaCaribbean small statesCayman IslandsCentral African RepublicCentral Europe and the BalticsChadChannel IslandsChileChinaColombiaComorosCongo, Dem. Rep.Congo, Rep.Costa RicaCote d'IvoireCroatiaCubaCuracaoCyprusCzech RepublicDenmarkDjiboutiDominicaDominican RepublicEarly-demographic dividendEast Asia & PacificEast Asia & Pacific (excluding high income)East Asia & Pacific (IDA & IBRD countries)EcuadorEgypt, Arab Rep.El SalvadorEquatorial GuineaEritreaEstoniaEthiopiaEuro areaEurope & Central AsiaEurope & Central Asia (excluding high income)Europe & Central Asia (IDA & IBRD countries)European UnionFaroe IslandsFijiFinlandFragile and conflict affected situationsFranceFrench PolynesiaGabonGambia, TheGeorgiaGermanyGhanaGibraltarGreeceGreenlandGrenadaGuamGuatemalaGuineaGuinea-BissauGuyanaHaitiHeavily indebted poor countries (HIPC)High incomeHondurasHong Kong SAR, ChinaHungaryIBRD onlyIcelandIDA & IBRD totalIDA blendIDA onlyIDA totalIndiaIndonesiaIran, Islamic Rep.IraqIrelandIsle of ManIsraelItalyJamaicaJapanJordanKazakhstanKenyaKiribatiKorea, Dem. People’s Rep.Korea, Rep.KosovoKuwaitKyrgyz RepublicLao PDRLate-demographic dividendLatin America & Caribbean Latin America & Caribbean (excluding high income)Latin America & the Caribbean (IDA & IBRD countries)LatviaLeast developed countries: UN classificationLebanonLesothoLiberiaLibyaLiechtensteinLithuaniaLow & middle incomeLow incomeLower middle incomeLuxembourgMacao SAR, ChinaMacedonia, FYRMadagascarMalawiMalaysiaMaldivesMaliMaltaMarshall IslandsMauritaniaMauritiusMexicoMicronesia, Fed. Sts.Middle East & North AfricaMiddle East & North Africa (excluding high income)Middle East & North Africa (IDA & IBRD countries)Middle incomeMoldovaMonacoMongoliaMontenegroMoroccoMozambiqueMyanmarNamibiaNauruNepalNetherlandsNew CaledoniaNew ZealandNicaraguaNigerNigeriaNorth AmericaNorthern Mariana IslandsNorwayOECD membersOmanOther small statesPacific island small statesPakistanPalauPanamaPapua New GuineaParaguayPeruPhilippinesPolandPortugalPost-demographic dividendPre-demographic dividendPuerto RicoQatarRomaniaRussian FederationRwandaSamoaSan MarinoSao Tome and PrincipeSaudi ArabiaSenegalSerbiaSeychellesSierra LeoneSingaporeSint Maarten (Dutch part)Slovak RepublicSloveniaSmall statesSolomon IslandsSomaliaSouth AfricaSouth AsiaSouth Asia (IDA & IBRD)South SudanSpainSri LankaSt. Kitts and NevisSt. LuciaSt. Martin (French part)St. Vincent and the GrenadinesSub-Saharan Africa Sub-Saharan Africa (excluding high income)Sub-Saharan Africa (IDA & IBRD countries)SudanSurinameSwazilandSwedenSwitzerlandSyrian Arab RepublicTajikistanTanzaniaThailandTimor-LesteTogoTongaTrinidad and TobagoTunisiaTurkeyTurkmenistanTurks and Caicos IslandsTuvaluUgandaUkraineUnited Arab EmiratesUnited KingdomUnited StatesUpper middle incomeUruguayUzbekistanVanuatuVenezuela, RBVietnamVirgin Islands (U.S.)West Bank and GazaWorldYemen, Rep.ZambiaZimbabwe Timeline:
This timeline shows a graph from 1971 to 2009 of Russian Federation. No data until 1970. Number of actual observations by date: 39.
Source name:
World Development Indicators
Source organization:
European Commission, Joint Research Centre (JRC)/Netherlands Environmental Assessment Agency (PBL). Emission Database for Global Atmospheric Research (EDGAR): http://edgar.jrc.ec.europa.eu/
Categories, topics:
Agriculture & Rural Development, Environment
Last updated:
apr 23, 2017
Indicators value changes by year
Minimum:
31.024K
jan 1, 2009
Maximum:
95.497K
jan 1, 1988
At the date of observation
Value
Absolute change
Change from previous value
jan 1, 1971
63.269K
+63.269K
0.0%
jan 1, 1972
66.808K
+3.539K
5.59%
jan 1, 1973
69.215K
+2.407K
3.6%
jan 1, 1974
72.155K
+2.94K
4.25%
jan 1, 1975
74.585K
+2.431K
3.37%
jan 1, 1976
77.501K
+2.916K
3.91%
jan 1, 1977
76.782K
-719.03
-0.93%
jan 1, 1978
78.405K
+1.622K
2.11%
jan 1, 1979
79.417K
+1.012K
1.29%
jan 1, 1980
79.639K
+222.065
0.28%
jan 1, 1981
82.283K
+2.644K
3.32%
jan 1, 1982
82.787K
+504.271
0.61%
jan 1, 1983
84.553K
+1.766K
2.13%
jan 1, 1984
89.068K
+4.516K
5.34%
jan 1, 1985
90.288K
+1.22K
1.37%
jan 1, 1986
92.511K
+2.223K
2.46%
jan 1, 1987
93.987K
+1.477K
1.6%
jan 1, 1988
95.497K
+1.51K
1.61%
jan 1, 1989
93.867K
-1.63K
-1.71%
jan 1, 1990
89.138K
-4.73K
-5.04%
jan 1, 1991
84.935K
-4.202K
-4.71%
jan 1, 1992
81.194K
-3.741K
-4.4%
jan 1, 1993
69.896K
-11.298K
-13.92%
jan 1, 1994
63.153K
-6.743K
-9.65%
jan 1, 1995
52.377K
-10.776K
-17.06%
jan 1, 1996
46.748K
-5.63K
-10.75%
jan 1, 1997
44.512K
-2.236K
-4.78%
jan 1, 1998
42.047K
-2.465K
-5.54%
jan 1, 1999
36.553K
-5.493K
-13.06%
jan 1, 2000
35.874K
-678.936
-1.86%
jan 1, 2001
36.096K
+221.746
0.62%
jan 1, 2002
37.535K
+1.439K
3.99%
jan 1, 2003
36.564K
-971.214
-2.59%
jan 1, 2004
34.488K
-2.075K
-5.68%
jan 1, 2005
34.889K
+400.442
1.16%
jan 1, 2006
33.749K
-1.14K
-3.27%
jan 1, 2007
32.929K
-819.872
-2.43%
jan 1, 2008
31.904K
-1.025K
-3.11%
jan 1, 2009
31.024K
-880.44
-2.76%
Ranking of countries by current statistics by years


Comments: