29
/
en
AIzaSyAYiBZKx7MnpbEhh9jyipgxe19OcubqV5w
April 1, 2024
75934
Bahamas, The
BHS
true
2
1
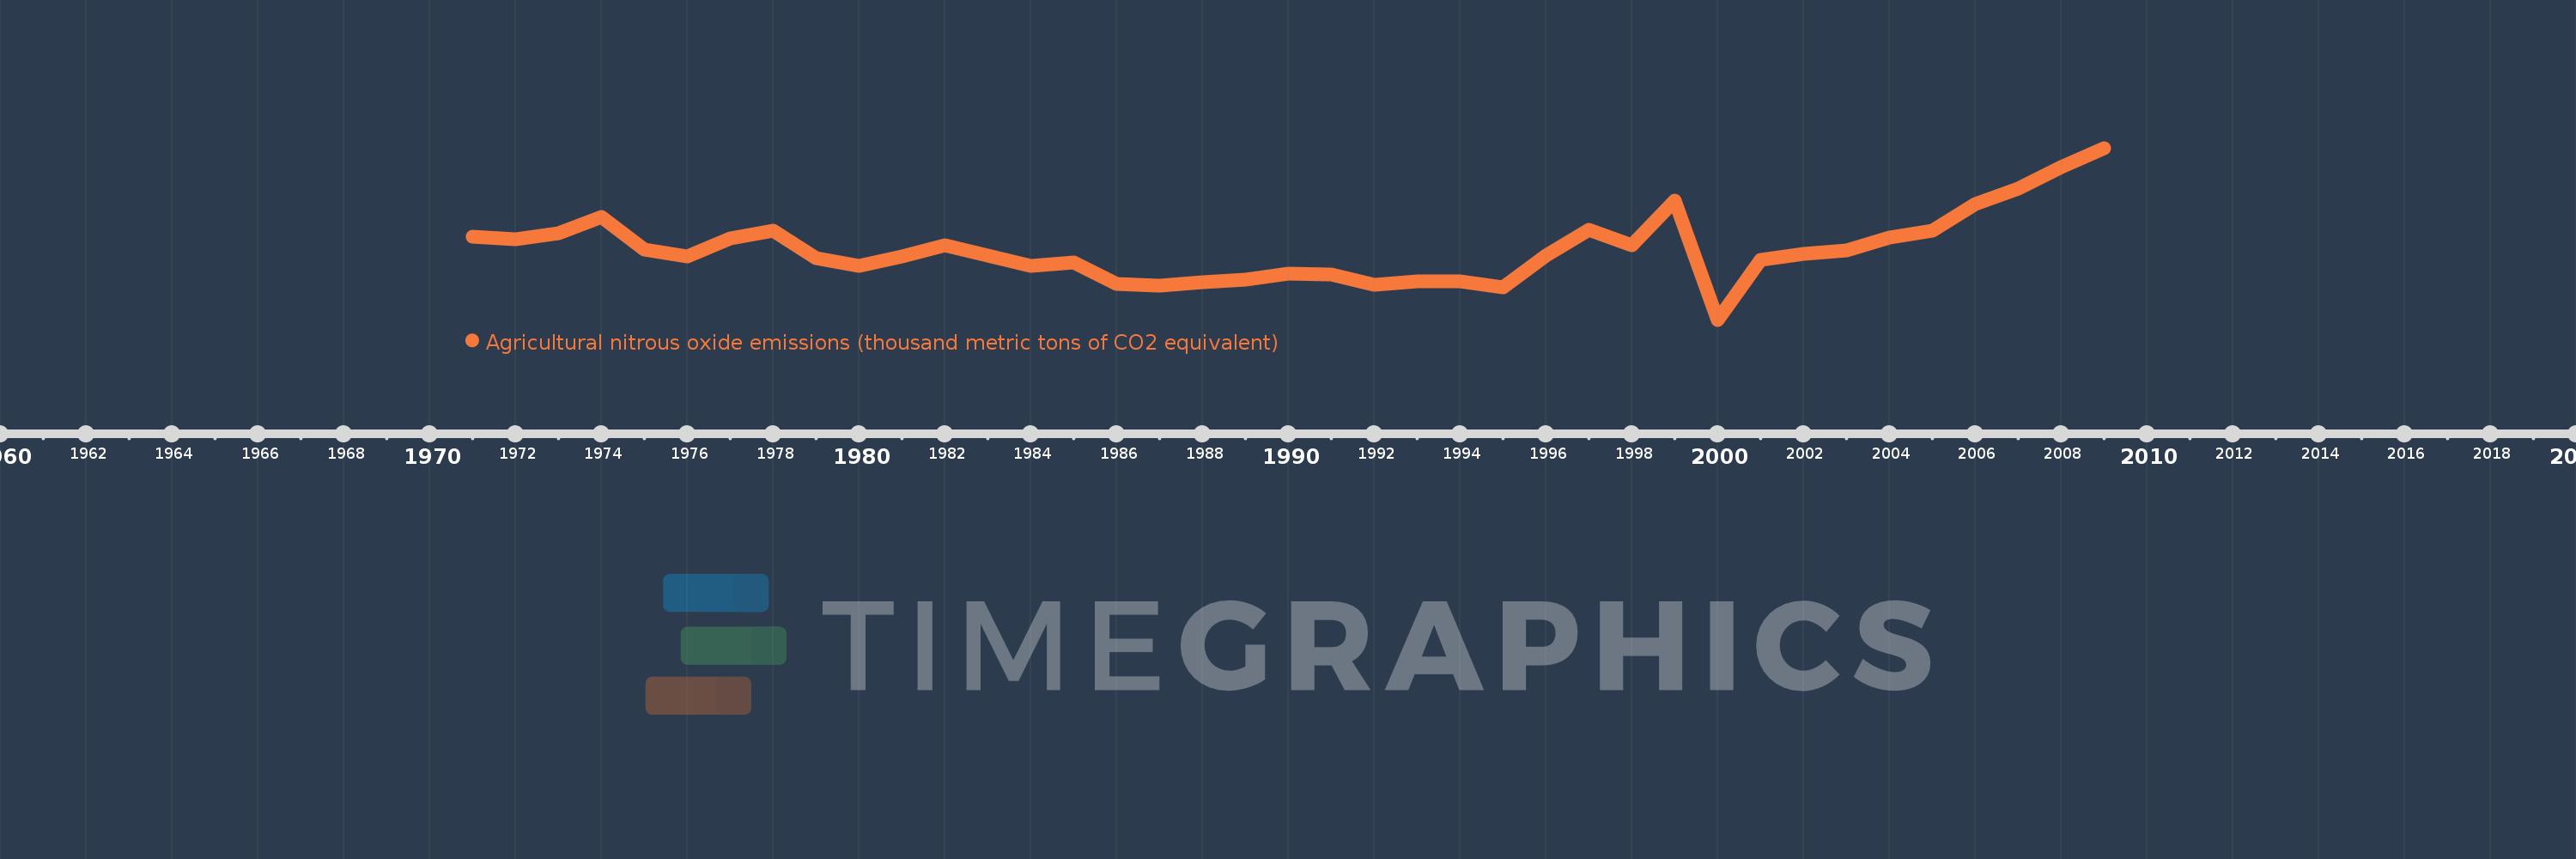
Agricultural nitrous oxide emissions (thousand metric tons of CO2 equivalent)
2009,2008,2007,2006,2005,2004,2003,2002,2001,2000,1999,1998,1997,1996,1995,1994,1993,1992,1991,1990,1989,1988,1987,1986,1985,1984,1983,1982,1981,1980,1979,1978,1977,1976,1975,1974,1973,1972,1971
This statistics in other country:
AfghanistanAlbaniaAlgeriaAmerican SamoaAndorraAngolaAntigua and BarbudaArab WorldArgentinaArmeniaArubaAustraliaAustriaAzerbaijanBahamas, TheBahrainBangladeshBarbadosBelarusBelgiumBelizeBeninBermudaBhutanBoliviaBosnia and HerzegovinaBotswanaBrazilBritish Virgin IslandsBrunei DarussalamBulgariaBurkina FasoBurundiCabo VerdeCambodiaCameroonCanadaCaribbean small statesCayman IslandsCentral African RepublicCentral Europe and the BalticsChadChannel IslandsChileChinaColombiaComorosCongo, Dem. Rep.Congo, Rep.Costa RicaCote d'IvoireCroatiaCubaCuracaoCyprusCzech RepublicDenmarkDjiboutiDominicaDominican RepublicEarly-demographic dividendEast Asia & PacificEast Asia & Pacific (excluding high income)East Asia & Pacific (IDA & IBRD countries)EcuadorEgypt, Arab Rep.El SalvadorEquatorial GuineaEritreaEstoniaEthiopiaEuro areaEurope & Central AsiaEurope & Central Asia (excluding high income)Europe & Central Asia (IDA & IBRD countries)European UnionFaroe IslandsFijiFinlandFragile and conflict affected situationsFranceFrench PolynesiaGabonGambia, TheGeorgiaGermanyGhanaGibraltarGreeceGreenlandGrenadaGuamGuatemalaGuineaGuinea-BissauGuyanaHaitiHeavily indebted poor countries (HIPC)High incomeHondurasHong Kong SAR, ChinaHungaryIBRD onlyIcelandIDA & IBRD totalIDA blendIDA onlyIDA totalIndiaIndonesiaIran, Islamic Rep.IraqIrelandIsle of ManIsraelItalyJamaicaJapanJordanKazakhstanKenyaKiribatiKorea, Dem. People’s Rep.Korea, Rep.KosovoKuwaitKyrgyz RepublicLao PDRLate-demographic dividendLatin America & Caribbean Latin America & Caribbean (excluding high income)Latin America & the Caribbean (IDA & IBRD countries)LatviaLeast developed countries: UN classificationLebanonLesothoLiberiaLibyaLiechtensteinLithuaniaLow & middle incomeLow incomeLower middle incomeLuxembourgMacao SAR, ChinaMacedonia, FYRMadagascarMalawiMalaysiaMaldivesMaliMaltaMarshall IslandsMauritaniaMauritiusMexicoMicronesia, Fed. Sts.Middle East & North AfricaMiddle East & North Africa (excluding high income)Middle East & North Africa (IDA & IBRD countries)Middle incomeMoldovaMonacoMongoliaMontenegroMoroccoMozambiqueMyanmarNamibiaNauruNepalNetherlandsNew CaledoniaNew ZealandNicaraguaNigerNigeriaNorth AmericaNorthern Mariana IslandsNorwayOECD membersOmanOther small statesPacific island small statesPakistanPalauPanamaPapua New GuineaParaguayPeruPhilippinesPolandPortugalPost-demographic dividendPre-demographic dividendPuerto RicoQatarRomaniaRussian FederationRwandaSamoaSan MarinoSao Tome and PrincipeSaudi ArabiaSenegalSerbiaSeychellesSierra LeoneSingaporeSint Maarten (Dutch part)Slovak RepublicSloveniaSmall statesSolomon IslandsSomaliaSouth AfricaSouth AsiaSouth Asia (IDA & IBRD)South SudanSpainSri LankaSt. Kitts and NevisSt. LuciaSt. Martin (French part)St. Vincent and the GrenadinesSub-Saharan Africa Sub-Saharan Africa (excluding high income)Sub-Saharan Africa (IDA & IBRD countries)SudanSurinameSwazilandSwedenSwitzerlandSyrian Arab RepublicTajikistanTanzaniaThailandTimor-LesteTogoTongaTrinidad and TobagoTunisiaTurkeyTurkmenistanTurks and Caicos IslandsTuvaluUgandaUkraineUnited Arab EmiratesUnited KingdomUnited StatesUpper middle incomeUruguayUzbekistanVanuatuVenezuela, RBVietnamVirgin Islands (U.S.)West Bank and GazaWorldYemen, Rep.ZambiaZimbabwe Timeline:
This timeline shows a graph from 1971 to 2009 of Bahamas, The. No data until 1970. Number of actual observations by date: 39.
Source name:
World Development Indicators
Source organization:
European Commission, Joint Research Centre (JRC)/Netherlands Environmental Assessment Agency (PBL). Emission Database for Global Atmospheric Research (EDGAR): http://edgar.jrc.ec.europa.eu/
Categories, topics:
Agriculture & Rural Development, Environment
Last updated:
apr 23, 2017
Indicators value changes by year
Maximum:
17.976
jan 1, 2009
At the date of observation
Value
Absolute change
Change from previous value
jan 1, 1971
10.337
+10.337
0.0%
jan 1, 1972
10.166
-0.171
-1.65%
jan 1, 1973
10.675
+0.509
5.01%
jan 1, 1974
12.025
+1.35
12.65%
jan 1, 1975
9.281
-2.744
-22.82%
jan 1, 1976
8.632
-0.649
-6.99%
jan 1, 1977
10.244
+1.612
18.68%
jan 1, 1978
10.866
+0.622
6.07%
jan 1, 1979
8.511
-2.355
-21.67%
jan 1, 1980
7.849
-0.662
-7.78%
jan 1, 1981
8.691
+0.842
10.73%
jan 1, 1982
9.604
+0.914
10.51%
jan 1, 1983
8.742
-0.863
-8.98%
jan 1, 1984
7.879
-0.863
-9.87%
jan 1, 1985
8.148
+0.269
3.42%
jan 1, 1986
6.264
-1.885
-23.13%
jan 1, 1987
6.144
-0.12
-1.92%
jan 1, 1988
6.47
+0.326
5.31%
jan 1, 1989
6.697
+0.227
3.5%
jan 1, 1990
7.18
+0.483
7.22%
jan 1, 1991
7.141
-0.039
-0.54%
jan 1, 1992
6.242
-0.899
-12.59%
jan 1, 1993
6.536
+0.294
4.7%
jan 1, 1994
6.541
+0.005
0.08%
jan 1, 1995
5.987
-0.554
-8.48%
jan 1, 1996
8.735
+2.748
45.9%
jan 1, 1997
10.931
+2.196
25.14%
jan 1, 1998
9.625
-1.306
-11.95%
jan 1, 1999
13.457
+3.832
39.81%
jan 1, 2000
3.224
-10.232
-76.04%
jan 1, 2001
8.386
+5.162
160.09%
jan 1, 2002
8.91
+0.524
6.25%
jan 1, 2003
9.163
+0.253
2.84%
jan 1, 2004
10.268
+1.104
12.05%
jan 1, 2005
10.857
+0.59
5.74%
jan 1, 2006
13.167
+2.31
21.28%
jan 1, 2007
14.454
+1.287
9.77%
jan 1, 2008
16.326
+1.872
12.95%
jan 1, 2009
17.976
+1.65
10.11%
Ranking of countries by current statistics by years


Comments: