29
/
en
AIzaSyAYiBZKx7MnpbEhh9jyipgxe19OcubqV5w
April 1, 2024
176070
Lebanon
LBN
true
2
1
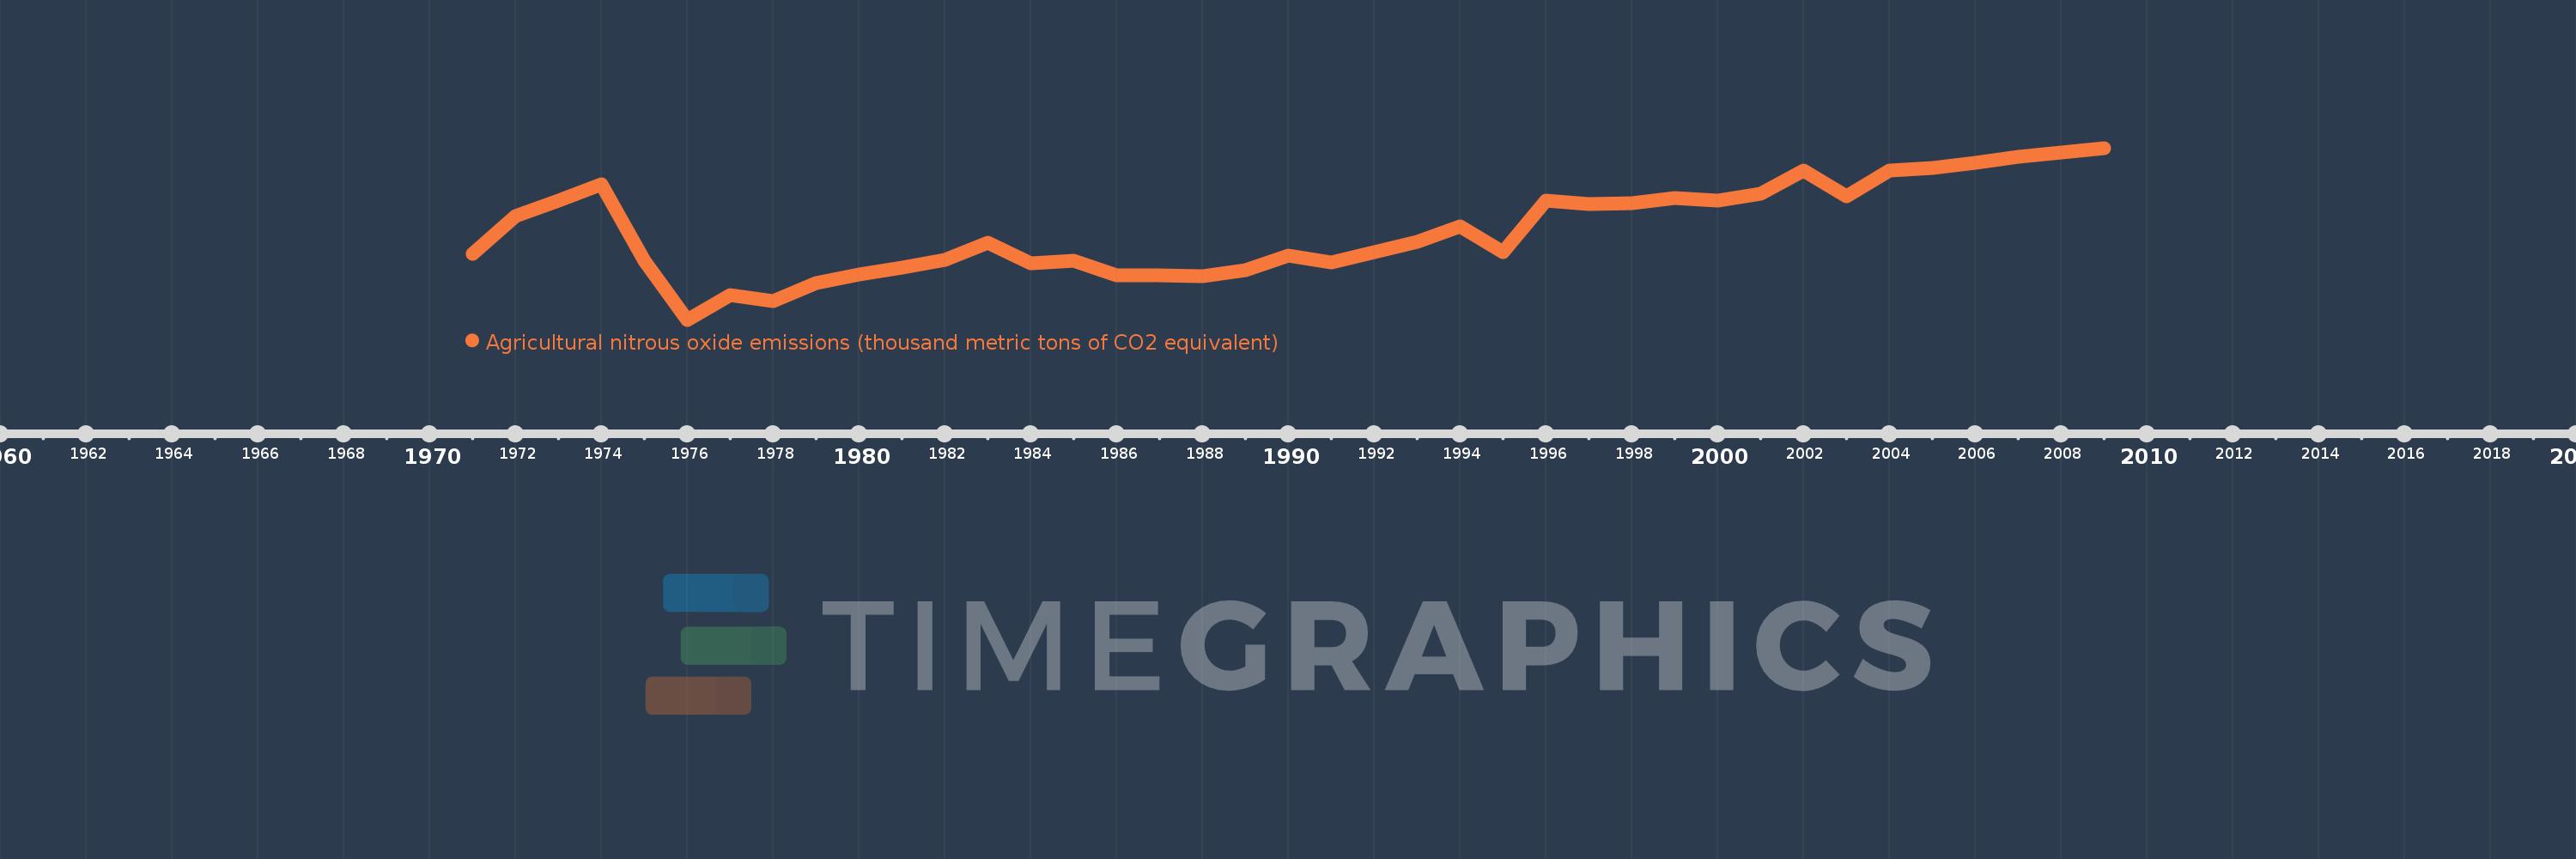
Agricultural nitrous oxide emissions (thousand metric tons of CO2 equivalent)
2009,2008,2007,2006,2005,2004,2003,2002,2001,2000,1999,1998,1997,1996,1995,1994,1993,1992,1991,1990,1989,1988,1987,1986,1985,1984,1983,1982,1981,1980,1979,1978,1977,1976,1975,1974,1973,1972,1971
This statistics in other country:
AfghanistanAlbaniaAlgeriaAmerican SamoaAndorraAngolaAntigua and BarbudaArab WorldArgentinaArmeniaArubaAustraliaAustriaAzerbaijanBahamas, TheBahrainBangladeshBarbadosBelarusBelgiumBelizeBeninBermudaBhutanBoliviaBosnia and HerzegovinaBotswanaBrazilBritish Virgin IslandsBrunei DarussalamBulgariaBurkina FasoBurundiCabo VerdeCambodiaCameroonCanadaCaribbean small statesCayman IslandsCentral African RepublicCentral Europe and the BalticsChadChannel IslandsChileChinaColombiaComorosCongo, Dem. Rep.Congo, Rep.Costa RicaCote d'IvoireCroatiaCubaCuracaoCyprusCzech RepublicDenmarkDjiboutiDominicaDominican RepublicEarly-demographic dividendEast Asia & PacificEast Asia & Pacific (excluding high income)East Asia & Pacific (IDA & IBRD countries)EcuadorEgypt, Arab Rep.El SalvadorEquatorial GuineaEritreaEstoniaEthiopiaEuro areaEurope & Central AsiaEurope & Central Asia (excluding high income)Europe & Central Asia (IDA & IBRD countries)European UnionFaroe IslandsFijiFinlandFragile and conflict affected situationsFranceFrench PolynesiaGabonGambia, TheGeorgiaGermanyGhanaGibraltarGreeceGreenlandGrenadaGuamGuatemalaGuineaGuinea-BissauGuyanaHaitiHeavily indebted poor countries (HIPC)High incomeHondurasHong Kong SAR, ChinaHungaryIBRD onlyIcelandIDA & IBRD totalIDA blendIDA onlyIDA totalIndiaIndonesiaIran, Islamic Rep.IraqIrelandIsle of ManIsraelItalyJamaicaJapanJordanKazakhstanKenyaKiribatiKorea, Dem. People’s Rep.Korea, Rep.KosovoKuwaitKyrgyz RepublicLao PDRLate-demographic dividendLatin America & Caribbean Latin America & Caribbean (excluding high income)Latin America & the Caribbean (IDA & IBRD countries)LatviaLeast developed countries: UN classificationLebanonLesothoLiberiaLibyaLiechtensteinLithuaniaLow & middle incomeLow incomeLower middle incomeLuxembourgMacao SAR, ChinaMacedonia, FYRMadagascarMalawiMalaysiaMaldivesMaliMaltaMarshall IslandsMauritaniaMauritiusMexicoMicronesia, Fed. Sts.Middle East & North AfricaMiddle East & North Africa (excluding high income)Middle East & North Africa (IDA & IBRD countries)Middle incomeMoldovaMonacoMongoliaMontenegroMoroccoMozambiqueMyanmarNamibiaNauruNepalNetherlandsNew CaledoniaNew ZealandNicaraguaNigerNigeriaNorth AmericaNorthern Mariana IslandsNorwayOECD membersOmanOther small statesPacific island small statesPakistanPalauPanamaPapua New GuineaParaguayPeruPhilippinesPolandPortugalPost-demographic dividendPre-demographic dividendPuerto RicoQatarRomaniaRussian FederationRwandaSamoaSan MarinoSao Tome and PrincipeSaudi ArabiaSenegalSerbiaSeychellesSierra LeoneSingaporeSint Maarten (Dutch part)Slovak RepublicSloveniaSmall statesSolomon IslandsSomaliaSouth AfricaSouth AsiaSouth Asia (IDA & IBRD)South SudanSpainSri LankaSt. Kitts and NevisSt. LuciaSt. Martin (French part)St. Vincent and the GrenadinesSub-Saharan Africa Sub-Saharan Africa (excluding high income)Sub-Saharan Africa (IDA & IBRD countries)SudanSurinameSwazilandSwedenSwitzerlandSyrian Arab RepublicTajikistanTanzaniaThailandTimor-LesteTogoTongaTrinidad and TobagoTunisiaTurkeyTurkmenistanTurks and Caicos IslandsTuvaluUgandaUkraineUnited Arab EmiratesUnited KingdomUnited StatesUpper middle incomeUruguayUzbekistanVanuatuVenezuela, RBVietnamVirgin Islands (U.S.)West Bank and GazaWorldYemen, Rep.ZambiaZimbabwe Timeline:
This timeline shows a graph from 1971 to 2009 of Lebanon. No data until 1970. Number of actual observations by date: 39.
Source name:
World Development Indicators
Source organization:
European Commission, Joint Research Centre (JRC)/Netherlands Environmental Assessment Agency (PBL). Emission Database for Global Atmospheric Research (EDGAR): http://edgar.jrc.ec.europa.eu/
Categories, topics:
Agriculture & Rural Development, Environment
Last updated:
apr 23, 2017
Indicators value changes by year
Minimum:
141.149
jan 1, 1976
Maximum:
418.144
jan 1, 2009
At the date of observation
Value
Absolute change
Change from previous value
jan 1, 1971
247.02
+247.02
0.0%
jan 1, 1972
308.036
+61.016
24.7%
jan 1, 1973
333.619
+25.583
8.31%
jan 1, 1974
359.963
+26.344
7.9%
jan 1, 1975
236.179
-123.784
-34.39%
jan 1, 1976
141.149
-95.03
-40.24%
jan 1, 1977
180.587
+39.438
27.94%
jan 1, 1978
171.054
-9.533
-5.28%
jan 1, 1979
199.984
+28.93
16.91%
jan 1, 1980
213.574
+13.589
6.8%
jan 1, 1981
224.998
+11.424
5.35%
jan 1, 1982
238.164
+13.166
5.85%
jan 1, 1983
265.291
+27.127
11.39%
jan 1, 1984
231.559
-33.732
-12.72%
jan 1, 1985
236.209
+4.649
2.01%
jan 1, 1986
212.088
-24.121
-10.21%
jan 1, 1987
212.413
+0.326
0.15%
jan 1, 1988
211.233
-1.18
-0.56%
jan 1, 1989
221.242
+10.008
4.74%
jan 1, 1990
244.523
+23.281
10.52%
jan 1, 1991
233.182
-11.341
-4.64%
jan 1, 1992
250.407
+17.225
7.39%
jan 1, 1993
266.756
+16.349
6.53%
jan 1, 1994
291.813
+25.058
9.39%
jan 1, 1995
250.697
-41.117
-14.09%
jan 1, 1996
333.769
+83.072
33.14%
jan 1, 1997
328.033
-5.736
-1.72%
jan 1, 1998
328.707
+0.674
0.21%
jan 1, 1999
337.637
+8.929
2.72%
jan 1, 2000
333.494
-4.143
-1.23%
jan 1, 2001
344.212
+10.718
3.21%
jan 1, 2002
381.824
+37.612
10.93%
jan 1, 2003
339.53
-42.294
-11.08%
jan 1, 2004
381.169
+41.639
12.26%
jan 1, 2005
386.472
+5.302
1.39%
jan 1, 2006
394.706
+8.234
2.13%
jan 1, 2007
404.233
+9.527
2.41%
jan 1, 2008
410.895
+6.663
1.65%
jan 1, 2009
418.144
+7.249
1.76%
Ranking of countries by current statistics by years


Comments: