29
/
en
AIzaSyAYiBZKx7MnpbEhh9jyipgxe19OcubqV5w
April 1, 2024
119593
Djibouti
DJI
true
2
1
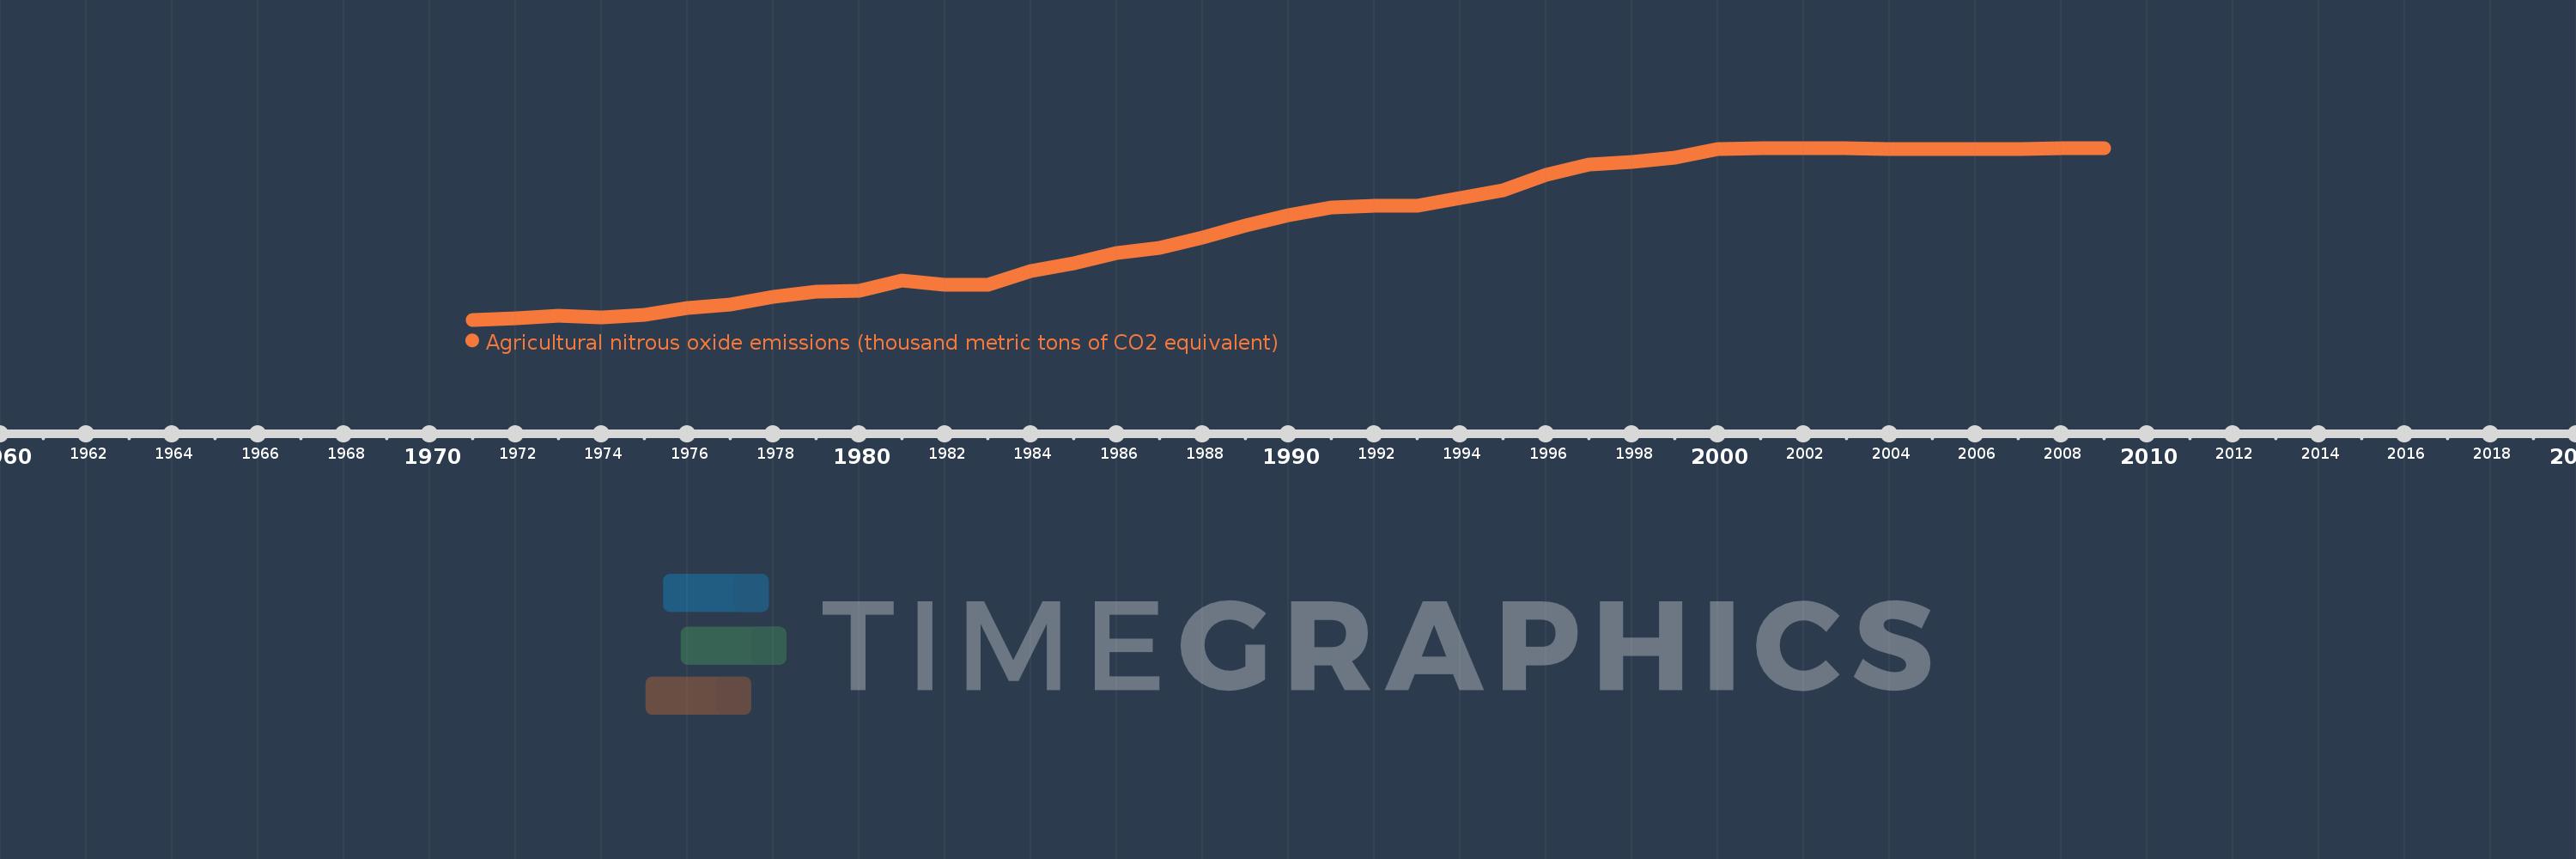
Agricultural nitrous oxide emissions (thousand metric tons of CO2 equivalent)
2009,2008,2007,2006,2005,2004,2003,2002,2001,2000,1999,1998,1997,1996,1995,1994,1993,1992,1991,1990,1989,1988,1987,1986,1985,1984,1983,1982,1981,1980,1979,1978,1977,1976,1975,1974,1973,1972,1971
This statistics in other country:
AfghanistanAlbaniaAlgeriaAmerican SamoaAndorraAngolaAntigua and BarbudaArab WorldArgentinaArmeniaArubaAustraliaAustriaAzerbaijanBahamas, TheBahrainBangladeshBarbadosBelarusBelgiumBelizeBeninBermudaBhutanBoliviaBosnia and HerzegovinaBotswanaBrazilBritish Virgin IslandsBrunei DarussalamBulgariaBurkina FasoBurundiCabo VerdeCambodiaCameroonCanadaCaribbean small statesCayman IslandsCentral African RepublicCentral Europe and the BalticsChadChannel IslandsChileChinaColombiaComorosCongo, Dem. Rep.Congo, Rep.Costa RicaCote d'IvoireCroatiaCubaCuracaoCyprusCzech RepublicDenmarkDjiboutiDominicaDominican RepublicEarly-demographic dividendEast Asia & PacificEast Asia & Pacific (excluding high income)East Asia & Pacific (IDA & IBRD countries)EcuadorEgypt, Arab Rep.El SalvadorEquatorial GuineaEritreaEstoniaEthiopiaEuro areaEurope & Central AsiaEurope & Central Asia (excluding high income)Europe & Central Asia (IDA & IBRD countries)European UnionFaroe IslandsFijiFinlandFragile and conflict affected situationsFranceFrench PolynesiaGabonGambia, TheGeorgiaGermanyGhanaGibraltarGreeceGreenlandGrenadaGuamGuatemalaGuineaGuinea-BissauGuyanaHaitiHeavily indebted poor countries (HIPC)High incomeHondurasHong Kong SAR, ChinaHungaryIBRD onlyIcelandIDA & IBRD totalIDA blendIDA onlyIDA totalIndiaIndonesiaIran, Islamic Rep.IraqIrelandIsle of ManIsraelItalyJamaicaJapanJordanKazakhstanKenyaKiribatiKorea, Dem. People’s Rep.Korea, Rep.KosovoKuwaitKyrgyz RepublicLao PDRLate-demographic dividendLatin America & Caribbean Latin America & Caribbean (excluding high income)Latin America & the Caribbean (IDA & IBRD countries)LatviaLeast developed countries: UN classificationLebanonLesothoLiberiaLibyaLiechtensteinLithuaniaLow & middle incomeLow incomeLower middle incomeLuxembourgMacao SAR, ChinaMacedonia, FYRMadagascarMalawiMalaysiaMaldivesMaliMaltaMarshall IslandsMauritaniaMauritiusMexicoMicronesia, Fed. Sts.Middle East & North AfricaMiddle East & North Africa (excluding high income)Middle East & North Africa (IDA & IBRD countries)Middle incomeMoldovaMonacoMongoliaMontenegroMoroccoMozambiqueMyanmarNamibiaNauruNepalNetherlandsNew CaledoniaNew ZealandNicaraguaNigerNigeriaNorth AmericaNorthern Mariana IslandsNorwayOECD membersOmanOther small statesPacific island small statesPakistanPalauPanamaPapua New GuineaParaguayPeruPhilippinesPolandPortugalPost-demographic dividendPre-demographic dividendPuerto RicoQatarRomaniaRussian FederationRwandaSamoaSan MarinoSao Tome and PrincipeSaudi ArabiaSenegalSerbiaSeychellesSierra LeoneSingaporeSint Maarten (Dutch part)Slovak RepublicSloveniaSmall statesSolomon IslandsSomaliaSouth AfricaSouth AsiaSouth Asia (IDA & IBRD)South SudanSpainSri LankaSt. Kitts and NevisSt. LuciaSt. Martin (French part)St. Vincent and the GrenadinesSub-Saharan Africa Sub-Saharan Africa (excluding high income)Sub-Saharan Africa (IDA & IBRD countries)SudanSurinameSwazilandSwedenSwitzerlandSyrian Arab RepublicTajikistanTanzaniaThailandTimor-LesteTogoTongaTrinidad and TobagoTunisiaTurkeyTurkmenistanTurks and Caicos IslandsTuvaluUgandaUkraineUnited Arab EmiratesUnited KingdomUnited StatesUpper middle incomeUruguayUzbekistanVanuatuVenezuela, RBVietnamVirgin Islands (U.S.)West Bank and GazaWorldYemen, Rep.ZambiaZimbabwe Timeline:
This timeline shows a graph from 1971 to 2009 of Djibouti. No data until 1970. Number of actual observations by date: 39.
Source name:
World Development Indicators
Source organization:
European Commission, Joint Research Centre (JRC)/Netherlands Environmental Assessment Agency (PBL). Emission Database for Global Atmospheric Research (EDGAR): http://edgar.jrc.ec.europa.eu/
Categories, topics:
Agriculture & Rural Development, Environment
Last updated:
apr 23, 2017
Indicators value changes by year
Minimum:
67.778
jan 1, 1971
Maximum:
208.188
jan 1, 2003
At the date of observation
Value
Absolute change
Change from previous value
jan 1, 1971
67.778
+67.778
0.0%
jan 1, 1972
69.174
+1.396
2.06%
jan 1, 1973
70.787
+1.613
2.33%
jan 1, 1974
69.726
-1.06
-1.5%
jan 1, 1975
71.669
+1.943
2.79%
jan 1, 1976
77.159
+5.49
7.66%
jan 1, 1977
79.873
+2.713
3.52%
jan 1, 1978
86.591
+6.719
8.41%
jan 1, 1979
90.619
+4.028
4.65%
jan 1, 1980
91.651
+1.032
1.14%
jan 1, 1981
100.02
+8.368
9.13%
jan 1, 1982
96.428
-3.592
-3.59%
jan 1, 1983
96.002
-0.426
-0.44%
jan 1, 1984
107.732
+11.73
12.22%
jan 1, 1985
113.793
+6.061
5.63%
jan 1, 1986
121.987
+8.194
7.2%
jan 1, 1987
126.647
+4.66
3.82%
jan 1, 1988
134.64
+7.993
6.31%
jan 1, 1989
144.538
+9.898
7.35%
jan 1, 1990
152.889
+8.351
5.78%
jan 1, 1991
159.73
+6.842
4.47%
jan 1, 1992
160.596
+0.865
0.54%
jan 1, 1993
160.912
+0.316
0.2%
jan 1, 1994
167.33
+6.418
3.99%
jan 1, 1995
173.226
+5.897
3.52%
jan 1, 1996
186.436
+13.209
7.63%
jan 1, 1997
194.645
+8.209
4.4%
jan 1, 1998
196.469
+1.824
0.94%
jan 1, 1999
200.507
+4.038
2.06%
jan 1, 2000
207.041
+6.534
3.26%
jan 1, 2001
207.92
+0.879
0.42%
jan 1, 2002
208.067
+0.147
0.07%
jan 1, 2003
208.188
+0.121
0.06%
jan 1, 2004
207.359
-0.828
-0.4%
jan 1, 2005
207.345
-0.014
-0.01%
jan 1, 2006
207.445
+0.1
0.05%
jan 1, 2007
207.589
+0.144
0.07%
jan 1, 2008
207.661
+0.072
0.03%
jan 1, 2009
207.769
+0.107
0.05%
Ranking of countries by current statistics by years


Comments: