29
/
en
AIzaSyAYiBZKx7MnpbEhh9jyipgxe19OcubqV5w
April 1, 2024
250477
St. Lucia
LCA
true
2
1
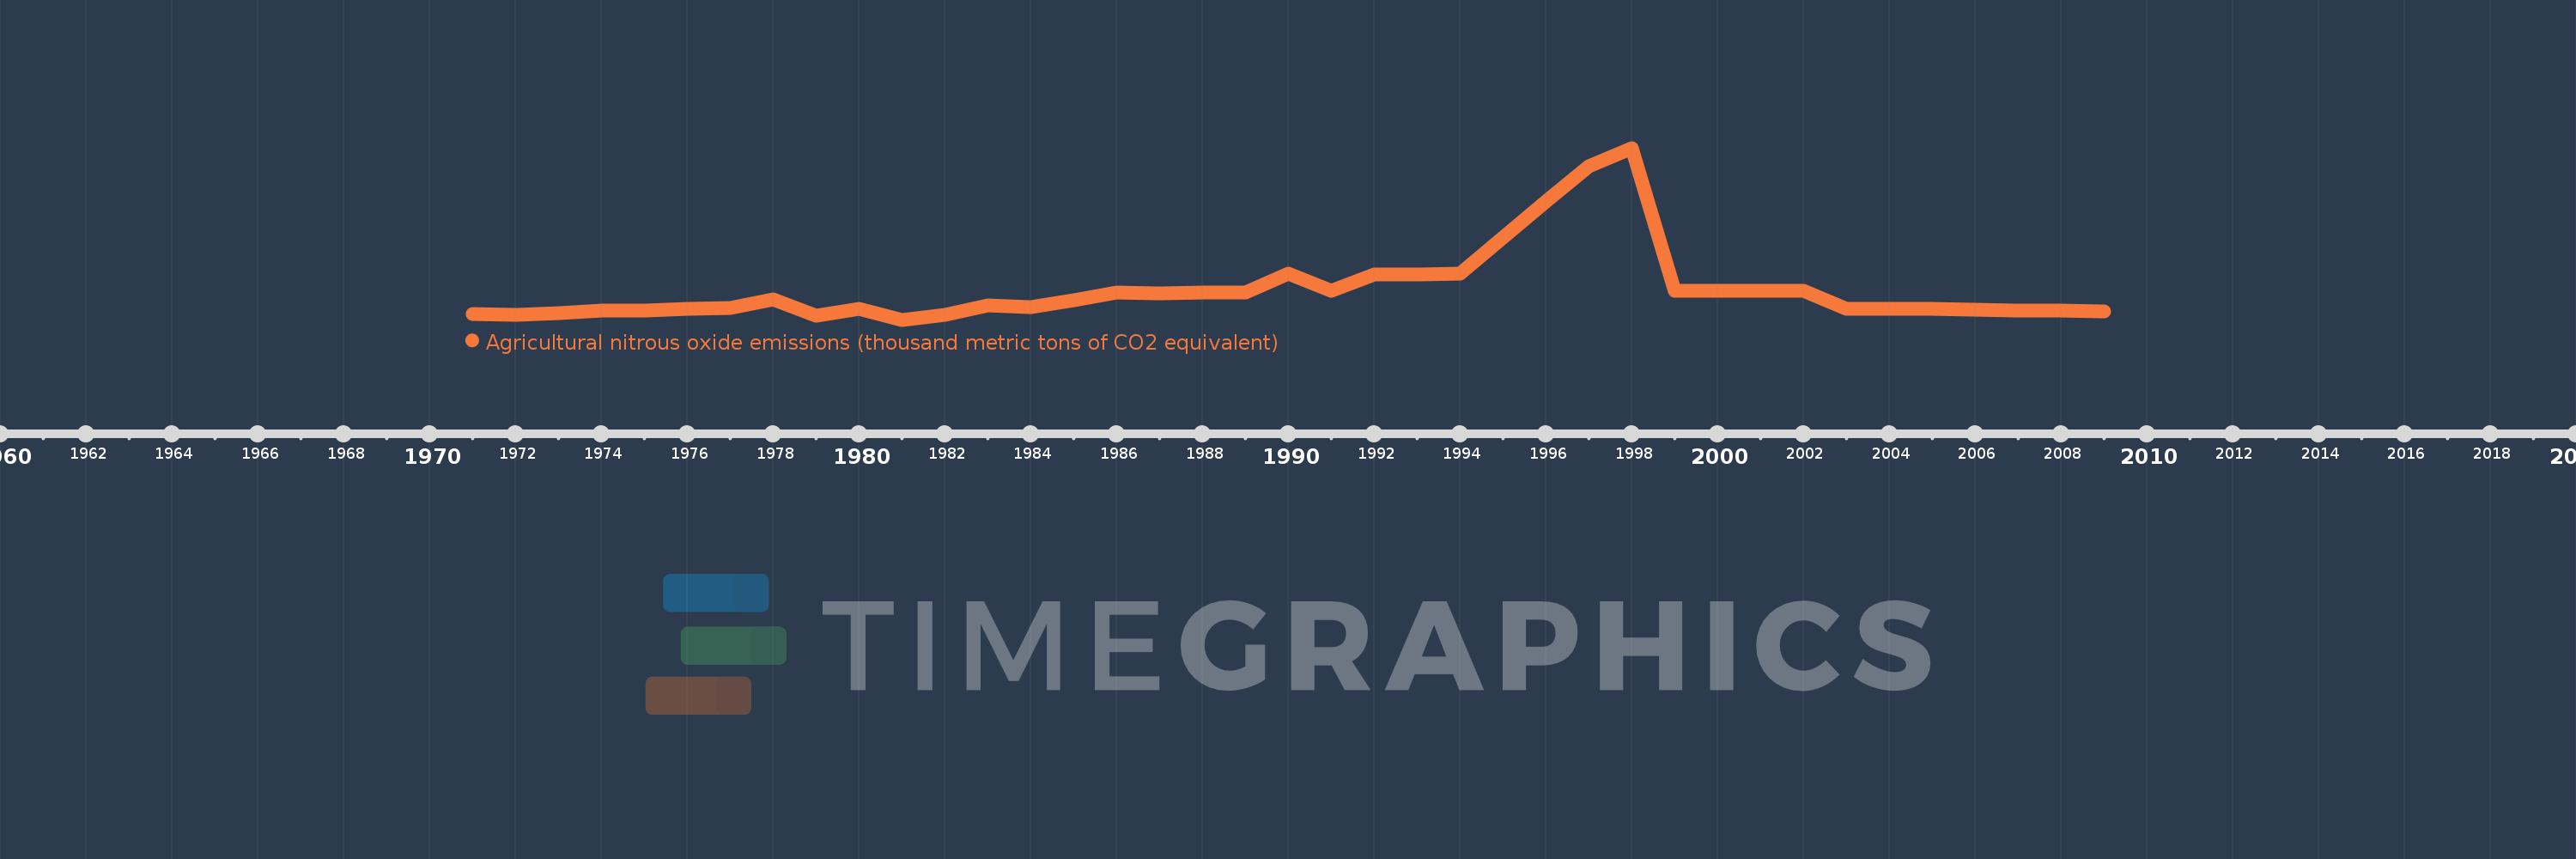
Agricultural nitrous oxide emissions (thousand metric tons of CO2 equivalent)
2009,2008,2007,2006,2005,2004,2003,2002,2001,2000,1999,1998,1997,1996,1995,1994,1993,1992,1991,1990,1989,1988,1987,1986,1985,1984,1983,1982,1981,1980,1979,1978,1977,1976,1975,1974,1973,1972,1971
This statistics in other country:
AfghanistanAlbaniaAlgeriaAmerican SamoaAndorraAngolaAntigua and BarbudaArab WorldArgentinaArmeniaArubaAustraliaAustriaAzerbaijanBahamas, TheBahrainBangladeshBarbadosBelarusBelgiumBelizeBeninBermudaBhutanBoliviaBosnia and HerzegovinaBotswanaBrazilBritish Virgin IslandsBrunei DarussalamBulgariaBurkina FasoBurundiCabo VerdeCambodiaCameroonCanadaCaribbean small statesCayman IslandsCentral African RepublicCentral Europe and the BalticsChadChannel IslandsChileChinaColombiaComorosCongo, Dem. Rep.Congo, Rep.Costa RicaCote d'IvoireCroatiaCubaCuracaoCyprusCzech RepublicDenmarkDjiboutiDominicaDominican RepublicEarly-demographic dividendEast Asia & PacificEast Asia & Pacific (excluding high income)East Asia & Pacific (IDA & IBRD countries)EcuadorEgypt, Arab Rep.El SalvadorEquatorial GuineaEritreaEstoniaEthiopiaEuro areaEurope & Central AsiaEurope & Central Asia (excluding high income)Europe & Central Asia (IDA & IBRD countries)European UnionFaroe IslandsFijiFinlandFragile and conflict affected situationsFranceFrench PolynesiaGabonGambia, TheGeorgiaGermanyGhanaGibraltarGreeceGreenlandGrenadaGuamGuatemalaGuineaGuinea-BissauGuyanaHaitiHeavily indebted poor countries (HIPC)High incomeHondurasHong Kong SAR, ChinaHungaryIBRD onlyIcelandIDA & IBRD totalIDA blendIDA onlyIDA totalIndiaIndonesiaIran, Islamic Rep.IraqIrelandIsle of ManIsraelItalyJamaicaJapanJordanKazakhstanKenyaKiribatiKorea, Dem. People’s Rep.Korea, Rep.KosovoKuwaitKyrgyz RepublicLao PDRLate-demographic dividendLatin America & Caribbean Latin America & Caribbean (excluding high income)Latin America & the Caribbean (IDA & IBRD countries)LatviaLeast developed countries: UN classificationLebanonLesothoLiberiaLibyaLiechtensteinLithuaniaLow & middle incomeLow incomeLower middle incomeLuxembourgMacao SAR, ChinaMacedonia, FYRMadagascarMalawiMalaysiaMaldivesMaliMaltaMarshall IslandsMauritaniaMauritiusMexicoMicronesia, Fed. Sts.Middle East & North AfricaMiddle East & North Africa (excluding high income)Middle East & North Africa (IDA & IBRD countries)Middle incomeMoldovaMonacoMongoliaMontenegroMoroccoMozambiqueMyanmarNamibiaNauruNepalNetherlandsNew CaledoniaNew ZealandNicaraguaNigerNigeriaNorth AmericaNorthern Mariana IslandsNorwayOECD membersOmanOther small statesPacific island small statesPakistanPalauPanamaPapua New GuineaParaguayPeruPhilippinesPolandPortugalPost-demographic dividendPre-demographic dividendPuerto RicoQatarRomaniaRussian FederationRwandaSamoaSan MarinoSao Tome and PrincipeSaudi ArabiaSenegalSerbiaSeychellesSierra LeoneSingaporeSint Maarten (Dutch part)Slovak RepublicSloveniaSmall statesSolomon IslandsSomaliaSouth AfricaSouth AsiaSouth Asia (IDA & IBRD)South SudanSpainSri LankaSt. Kitts and NevisSt. LuciaSt. Martin (French part)St. Vincent and the GrenadinesSub-Saharan Africa Sub-Saharan Africa (excluding high income)Sub-Saharan Africa (IDA & IBRD countries)SudanSurinameSwazilandSwedenSwitzerlandSyrian Arab RepublicTajikistanTanzaniaThailandTimor-LesteTogoTongaTrinidad and TobagoTunisiaTurkeyTurkmenistanTurks and Caicos IslandsTuvaluUgandaUkraineUnited Arab EmiratesUnited KingdomUnited StatesUpper middle incomeUruguayUzbekistanVanuatuVenezuela, RBVietnamVirgin Islands (U.S.)West Bank and GazaWorldYemen, Rep.ZambiaZimbabwe Timeline:
This timeline shows a graph from 1971 to 2009 of St. Lucia. No data until 1970. Number of actual observations by date: 39.
Source name:
World Development Indicators
Source organization:
European Commission, Joint Research Centre (JRC)/Netherlands Environmental Assessment Agency (PBL). Emission Database for Global Atmospheric Research (EDGAR): http://edgar.jrc.ec.europa.eu/
Categories, topics:
Agriculture & Rural Development, Environment
Last updated:
apr 23, 2017
Indicators value changes by year
Minimum:
13.024
jan 1, 1981
Maximum:
73.597
jan 1, 1998
At the date of observation
Value
Absolute change
Change from previous value
jan 1, 1971
15.164
+15.164
0.0%
jan 1, 1972
14.881
-0.283
-1.87%
jan 1, 1973
15.256
+0.375
2.52%
jan 1, 1974
16.387
+1.131
7.42%
jan 1, 1975
16.318
-0.069
-0.42%
jan 1, 1976
17.009
+0.692
4.24%
jan 1, 1977
17.277
+0.268
1.58%
jan 1, 1978
20.174
+2.897
16.77%
jan 1, 1979
14.588
-5.586
-27.69%
jan 1, 1980
16.849
+2.261
15.5%
jan 1, 1981
13.024
-3.825
-22.7%
jan 1, 1982
14.834
+1.81
13.9%
jan 1, 1983
18.109
+3.274
22.07%
jan 1, 1984
17.326
-0.783
-4.32%
jan 1, 1985
19.789
+2.463
14.22%
jan 1, 1986
22.492
+2.702
13.66%
jan 1, 1987
22.416
-0.075
-0.34%
jan 1, 1988
22.65
+0.234
1.04%
jan 1, 1989
22.739
+0.089
0.39%
jan 1, 1990
29.228
+6.489
28.54%
jan 1, 1991
23.117
-6.111
-20.91%
jan 1, 1992
29.067
+5.951
25.74%
jan 1, 1993
29.112
+0.044
0.15%
jan 1, 1994
29.229
+0.118
0.4%
jan 1, 1995
42.055
+12.826
43.88%
jan 1, 1996
54.673
+12.618
30.0%
jan 1, 1997
67.268
+12.595
23.04%
jan 1, 1998
73.597
+6.329
9.41%
jan 1, 1999
23.262
-50.335
-68.39%
jan 1, 2000
23.083
-0.179
-0.77%
jan 1, 2001
23.199
+0.116
0.5%
jan 1, 2002
23.227
+0.028
0.12%
jan 1, 2003
16.784
-6.444
-27.74%
jan 1, 2004
16.907
+0.123
0.73%
jan 1, 2005
16.991
+0.084
0.5%
jan 1, 2006
16.57
-0.421
-2.48%
jan 1, 2007
16.413
-0.157
-0.95%
jan 1, 2008
16.171
-0.243
-1.48%
jan 1, 2009
15.949
-0.222
-1.37%
Ranking of countries by current statistics by years


Comments: