29
/
en
AIzaSyAYiBZKx7MnpbEhh9jyipgxe19OcubqV5w
April 1, 2024
215000
Oman
OMN
true
2
1
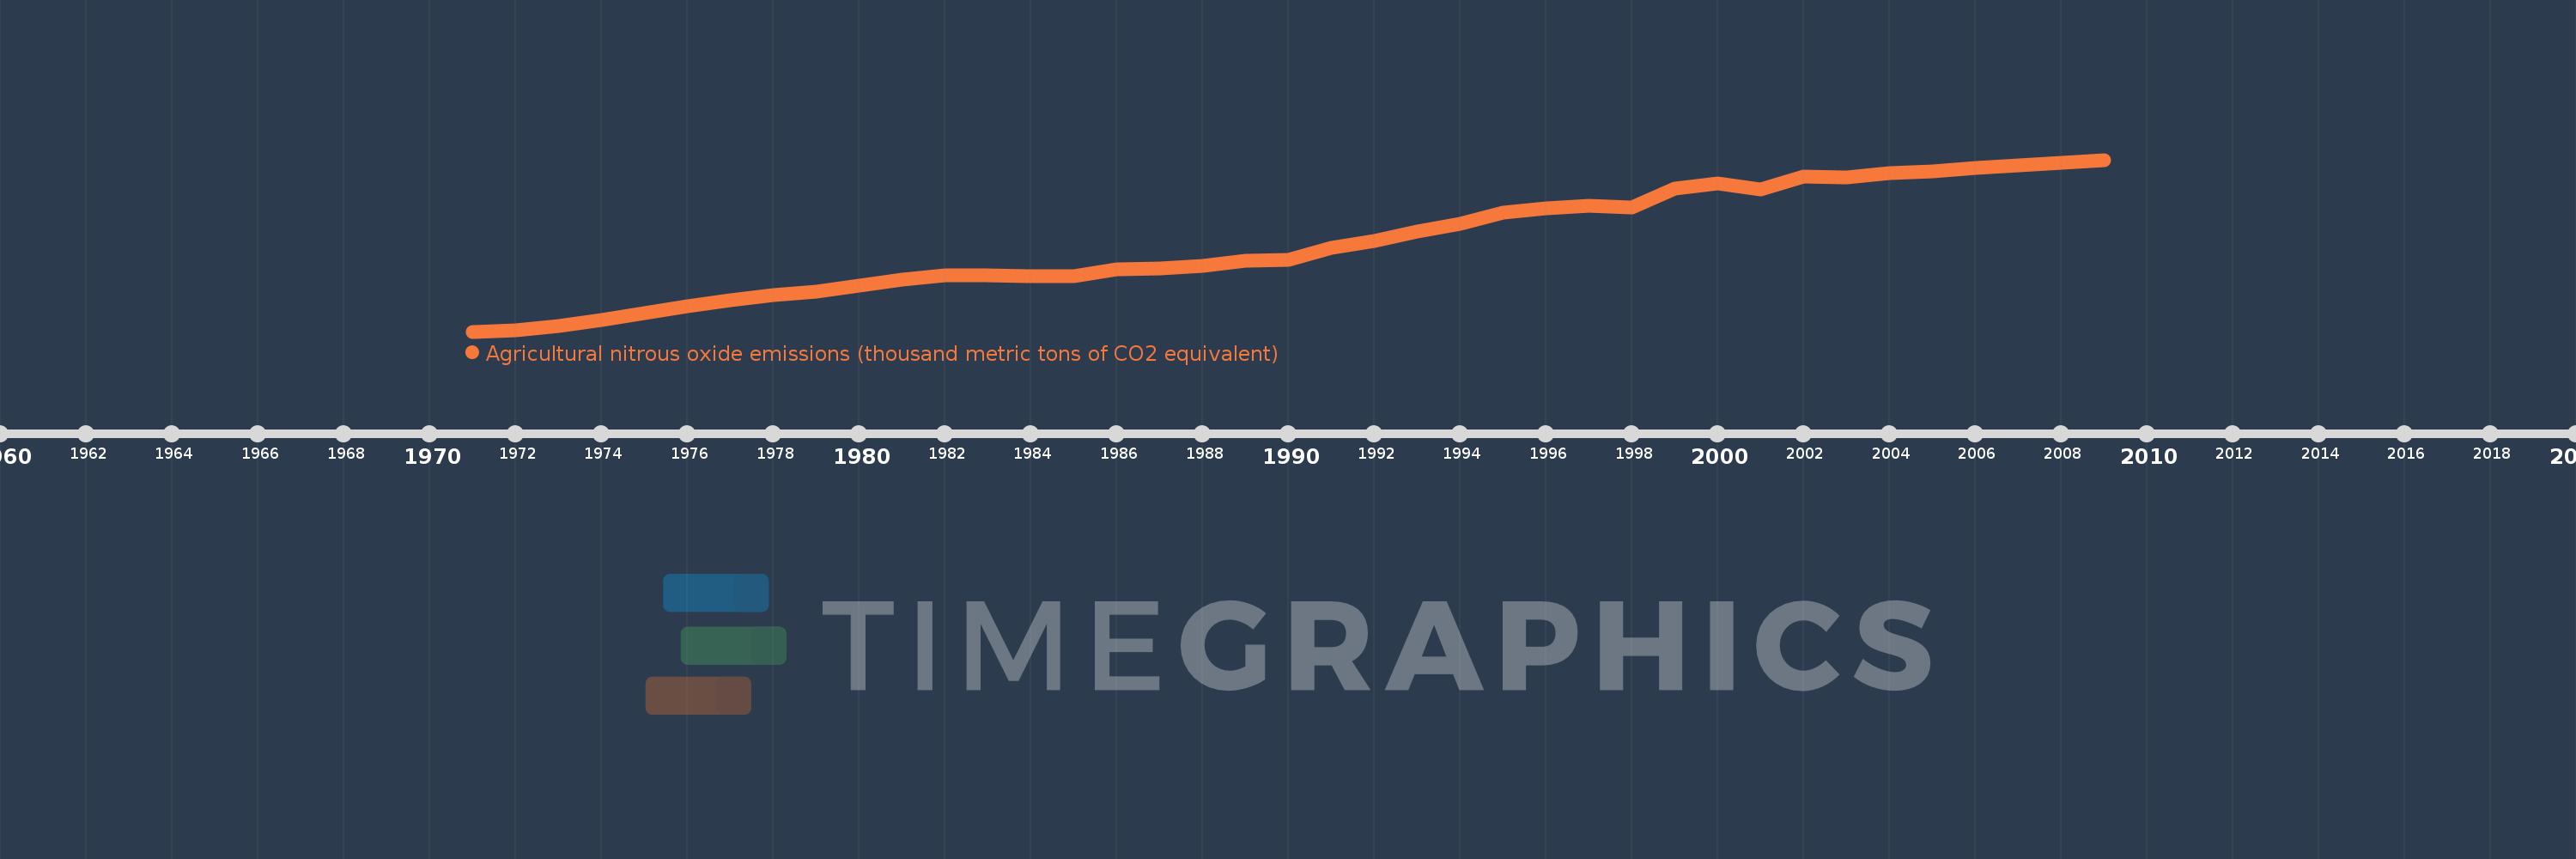
Agricultural nitrous oxide emissions (thousand metric tons of CO2 equivalent)
2009,2008,2007,2006,2005,2004,2003,2002,2001,2000,1999,1998,1997,1996,1995,1994,1993,1992,1991,1990,1989,1988,1987,1986,1985,1984,1983,1982,1981,1980,1979,1978,1977,1976,1975,1974,1973,1972,1971
This statistics in other country:
AfghanistanAlbaniaAlgeriaAmerican SamoaAndorraAngolaAntigua and BarbudaArab WorldArgentinaArmeniaArubaAustraliaAustriaAzerbaijanBahamas, TheBahrainBangladeshBarbadosBelarusBelgiumBelizeBeninBermudaBhutanBoliviaBosnia and HerzegovinaBotswanaBrazilBritish Virgin IslandsBrunei DarussalamBulgariaBurkina FasoBurundiCabo VerdeCambodiaCameroonCanadaCaribbean small statesCayman IslandsCentral African RepublicCentral Europe and the BalticsChadChannel IslandsChileChinaColombiaComorosCongo, Dem. Rep.Congo, Rep.Costa RicaCote d'IvoireCroatiaCubaCuracaoCyprusCzech RepublicDenmarkDjiboutiDominicaDominican RepublicEarly-demographic dividendEast Asia & PacificEast Asia & Pacific (excluding high income)East Asia & Pacific (IDA & IBRD countries)EcuadorEgypt, Arab Rep.El SalvadorEquatorial GuineaEritreaEstoniaEthiopiaEuro areaEurope & Central AsiaEurope & Central Asia (excluding high income)Europe & Central Asia (IDA & IBRD countries)European UnionFaroe IslandsFijiFinlandFragile and conflict affected situationsFranceFrench PolynesiaGabonGambia, TheGeorgiaGermanyGhanaGibraltarGreeceGreenlandGrenadaGuamGuatemalaGuineaGuinea-BissauGuyanaHaitiHeavily indebted poor countries (HIPC)High incomeHondurasHong Kong SAR, ChinaHungaryIBRD onlyIcelandIDA & IBRD totalIDA blendIDA onlyIDA totalIndiaIndonesiaIran, Islamic Rep.IraqIrelandIsle of ManIsraelItalyJamaicaJapanJordanKazakhstanKenyaKiribatiKorea, Dem. People’s Rep.Korea, Rep.KosovoKuwaitKyrgyz RepublicLao PDRLate-demographic dividendLatin America & Caribbean Latin America & Caribbean (excluding high income)Latin America & the Caribbean (IDA & IBRD countries)LatviaLeast developed countries: UN classificationLebanonLesothoLiberiaLibyaLiechtensteinLithuaniaLow & middle incomeLow incomeLower middle incomeLuxembourgMacao SAR, ChinaMacedonia, FYRMadagascarMalawiMalaysiaMaldivesMaliMaltaMarshall IslandsMauritaniaMauritiusMexicoMicronesia, Fed. Sts.Middle East & North AfricaMiddle East & North Africa (excluding high income)Middle East & North Africa (IDA & IBRD countries)Middle incomeMoldovaMonacoMongoliaMontenegroMoroccoMozambiqueMyanmarNamibiaNauruNepalNetherlandsNew CaledoniaNew ZealandNicaraguaNigerNigeriaNorth AmericaNorthern Mariana IslandsNorwayOECD membersOmanOther small statesPacific island small statesPakistanPalauPanamaPapua New GuineaParaguayPeruPhilippinesPolandPortugalPost-demographic dividendPre-demographic dividendPuerto RicoQatarRomaniaRussian FederationRwandaSamoaSan MarinoSao Tome and PrincipeSaudi ArabiaSenegalSerbiaSeychellesSierra LeoneSingaporeSint Maarten (Dutch part)Slovak RepublicSloveniaSmall statesSolomon IslandsSomaliaSouth AfricaSouth AsiaSouth Asia (IDA & IBRD)South SudanSpainSri LankaSt. Kitts and NevisSt. LuciaSt. Martin (French part)St. Vincent and the GrenadinesSub-Saharan Africa Sub-Saharan Africa (excluding high income)Sub-Saharan Africa (IDA & IBRD countries)SudanSurinameSwazilandSwedenSwitzerlandSyrian Arab RepublicTajikistanTanzaniaThailandTimor-LesteTogoTongaTrinidad and TobagoTunisiaTurkeyTurkmenistanTurks and Caicos IslandsTuvaluUgandaUkraineUnited Arab EmiratesUnited KingdomUnited StatesUpper middle incomeUruguayUzbekistanVanuatuVenezuela, RBVietnamVirgin Islands (U.S.)West Bank and GazaWorldYemen, Rep.ZambiaZimbabwe Timeline:
This timeline shows a graph from 1971 to 2009 of Oman. No data until 1970. Number of actual observations by date: 39.
Source name:
World Development Indicators
Source organization:
European Commission, Joint Research Centre (JRC)/Netherlands Environmental Assessment Agency (PBL). Emission Database for Global Atmospheric Research (EDGAR): http://edgar.jrc.ec.europa.eu/
Categories, topics:
Agriculture & Rural Development, Environment
Last updated:
apr 23, 2017
Indicators value changes by year
Minimum:
62.616
jan 1, 1971
Maximum:
397.381
jan 1, 2009
At the date of observation
Value
Absolute change
Change from previous value
jan 1, 1971
62.616
+62.616
0.0%
jan 1, 1972
65.483
+2.868
4.58%
jan 1, 1973
74.13
+8.646
13.2%
jan 1, 1974
84.465
+10.335
13.94%
jan 1, 1975
99.193
+14.729
17.44%
jan 1, 1976
112.088
+12.895
13.0%
jan 1, 1977
123.112
+11.024
9.84%
jan 1, 1978
134.097
+10.985
8.92%
jan 1, 1979
139.746
+5.648
4.21%
jan 1, 1980
151.885
+12.139
8.69%
jan 1, 1981
163.983
+12.099
7.97%
jan 1, 1982
171.637
+7.653
4.67%
jan 1, 1983
172.282
+0.646
0.38%
jan 1, 1984
170.203
-2.08
-1.21%
jan 1, 1985
171.136
+0.933
0.55%
jan 1, 1986
183.453
+12.317
7.2%
jan 1, 1987
185.761
+2.308
1.26%
jan 1, 1988
189.96
+4.2
2.26%
jan 1, 1989
200.684
+10.724
5.65%
jan 1, 1990
202.338
+1.654
0.82%
jan 1, 1991
225.013
+22.675
11.21%
jan 1, 1992
239.265
+14.252
6.33%
jan 1, 1993
257.098
+17.833
7.45%
jan 1, 1994
271.986
+14.887
5.79%
jan 1, 1995
294.705
+22.719
8.35%
jan 1, 1996
303.145
+8.44
2.86%
jan 1, 1997
307.221
+4.076
1.34%
jan 1, 1998
305.127
-2.094
-0.68%
jan 1, 1999
341.483
+36.356
11.92%
jan 1, 2000
351.545
+10.061
2.95%
jan 1, 2001
340.407
-11.137
-3.17%
jan 1, 2002
364.155
+23.747
6.98%
jan 1, 2003
363.713
-0.441
-0.12%
jan 1, 2004
371.117
+7.404
2.04%
jan 1, 2005
374.69
+3.573
0.96%
jan 1, 2006
381.376
+6.685
1.78%
jan 1, 2007
386.22
+4.844
1.27%
jan 1, 2008
392.063
+5.843
1.51%
jan 1, 2009
397.381
+5.318
1.36%
Ranking of countries by current statistics by years


Comments: