29
/
en
AIzaSyAYiBZKx7MnpbEhh9jyipgxe19OcubqV5w
April 1, 2024
105663
China
CHN
true
2
1
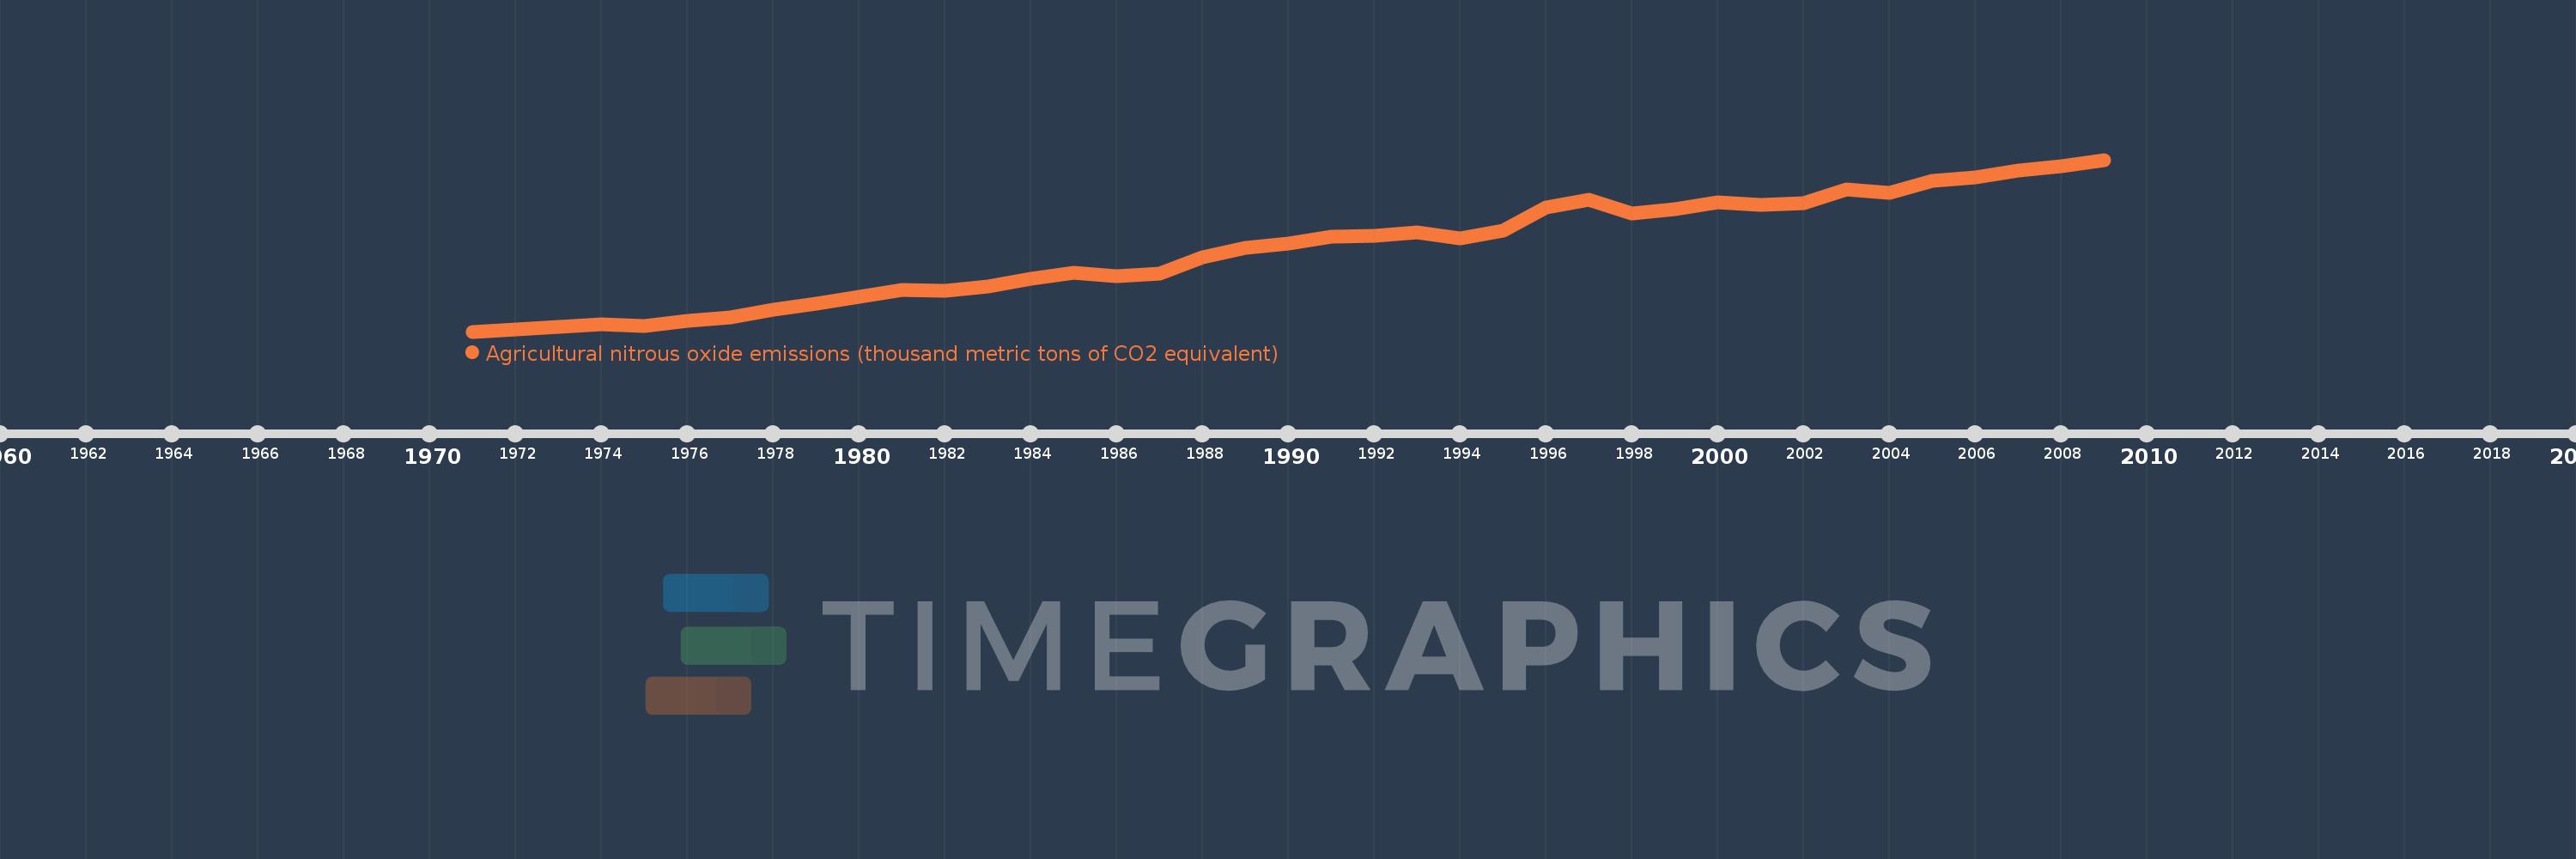
Agricultural nitrous oxide emissions (thousand metric tons of CO2 equivalent)
2009,2008,2007,2006,2005,2004,2003,2002,2001,2000,1999,1998,1997,1996,1995,1994,1993,1992,1991,1990,1989,1988,1987,1986,1985,1984,1983,1982,1981,1980,1979,1978,1977,1976,1975,1974,1973,1972,1971
This statistics in other country:
AfghanistanAlbaniaAlgeriaAmerican SamoaAndorraAngolaAntigua and BarbudaArab WorldArgentinaArmeniaArubaAustraliaAustriaAzerbaijanBahamas, TheBahrainBangladeshBarbadosBelarusBelgiumBelizeBeninBermudaBhutanBoliviaBosnia and HerzegovinaBotswanaBrazilBritish Virgin IslandsBrunei DarussalamBulgariaBurkina FasoBurundiCabo VerdeCambodiaCameroonCanadaCaribbean small statesCayman IslandsCentral African RepublicCentral Europe and the BalticsChadChannel IslandsChileChinaColombiaComorosCongo, Dem. Rep.Congo, Rep.Costa RicaCote d'IvoireCroatiaCubaCuracaoCyprusCzech RepublicDenmarkDjiboutiDominicaDominican RepublicEarly-demographic dividendEast Asia & PacificEast Asia & Pacific (excluding high income)East Asia & Pacific (IDA & IBRD countries)EcuadorEgypt, Arab Rep.El SalvadorEquatorial GuineaEritreaEstoniaEthiopiaEuro areaEurope & Central AsiaEurope & Central Asia (excluding high income)Europe & Central Asia (IDA & IBRD countries)European UnionFaroe IslandsFijiFinlandFragile and conflict affected situationsFranceFrench PolynesiaGabonGambia, TheGeorgiaGermanyGhanaGibraltarGreeceGreenlandGrenadaGuamGuatemalaGuineaGuinea-BissauGuyanaHaitiHeavily indebted poor countries (HIPC)High incomeHondurasHong Kong SAR, ChinaHungaryIBRD onlyIcelandIDA & IBRD totalIDA blendIDA onlyIDA totalIndiaIndonesiaIran, Islamic Rep.IraqIrelandIsle of ManIsraelItalyJamaicaJapanJordanKazakhstanKenyaKiribatiKorea, Dem. People’s Rep.Korea, Rep.KosovoKuwaitKyrgyz RepublicLao PDRLate-demographic dividendLatin America & Caribbean Latin America & Caribbean (excluding high income)Latin America & the Caribbean (IDA & IBRD countries)LatviaLeast developed countries: UN classificationLebanonLesothoLiberiaLibyaLiechtensteinLithuaniaLow & middle incomeLow incomeLower middle incomeLuxembourgMacao SAR, ChinaMacedonia, FYRMadagascarMalawiMalaysiaMaldivesMaliMaltaMarshall IslandsMauritaniaMauritiusMexicoMicronesia, Fed. Sts.Middle East & North AfricaMiddle East & North Africa (excluding high income)Middle East & North Africa (IDA & IBRD countries)Middle incomeMoldovaMonacoMongoliaMontenegroMoroccoMozambiqueMyanmarNamibiaNauruNepalNetherlandsNew CaledoniaNew ZealandNicaraguaNigerNigeriaNorth AmericaNorthern Mariana IslandsNorwayOECD membersOmanOther small statesPacific island small statesPakistanPalauPanamaPapua New GuineaParaguayPeruPhilippinesPolandPortugalPost-demographic dividendPre-demographic dividendPuerto RicoQatarRomaniaRussian FederationRwandaSamoaSan MarinoSao Tome and PrincipeSaudi ArabiaSenegalSerbiaSeychellesSierra LeoneSingaporeSint Maarten (Dutch part)Slovak RepublicSloveniaSmall statesSolomon IslandsSomaliaSouth AfricaSouth AsiaSouth Asia (IDA & IBRD)South SudanSpainSri LankaSt. Kitts and NevisSt. LuciaSt. Martin (French part)St. Vincent and the GrenadinesSub-Saharan Africa Sub-Saharan Africa (excluding high income)Sub-Saharan Africa (IDA & IBRD countries)SudanSurinameSwazilandSwedenSwitzerlandSyrian Arab RepublicTajikistanTanzaniaThailandTimor-LesteTogoTongaTrinidad and TobagoTunisiaTurkeyTurkmenistanTurks and Caicos IslandsTuvaluUgandaUkraineUnited Arab EmiratesUnited KingdomUnited StatesUpper middle incomeUruguayUzbekistanVanuatuVenezuela, RBVietnamVirgin Islands (U.S.)West Bank and GazaWorldYemen, Rep.ZambiaZimbabwe Timeline:
This timeline shows a graph from 1971 to 2009 of China. No data until 1970. Number of actual observations by date: 39.
Source name:
World Development Indicators
Source organization:
European Commission, Joint Research Centre (JRC)/Netherlands Environmental Assessment Agency (PBL). Emission Database for Global Atmospheric Research (EDGAR): http://edgar.jrc.ec.europa.eu/
Categories, topics:
Agriculture & Rural Development, Environment
Last updated:
apr 23, 2017
Indicators value changes by year
Minimum:
103.876K
jan 1, 1971
Maximum:
375.436K
jan 1, 2009
At the date of observation
Value
Absolute change
Change from previous value
jan 1, 1971
103.876K
+103.876K
0.0%
jan 1, 1972
106.67K
+2.794K
2.69%
jan 1, 1973
110.765K
+4.095K
3.84%
jan 1, 1974
115.913K
+5.148K
4.65%
jan 1, 1975
113.086K
-2.827K
-2.44%
jan 1, 1976
120.882K
+7.796K
6.89%
jan 1, 1977
126.941K
+6.059K
5.01%
jan 1, 1978
138.184K
+11.243K
8.86%
jan 1, 1979
148.518K
+10.334K
7.48%
jan 1, 1980
159.151K
+10.633K
7.16%
jan 1, 1981
170.254K
+11.104K
6.98%
jan 1, 1982
168.343K
-1.911K
-1.12%
jan 1, 1983
175.259K
+6.916K
4.11%
jan 1, 1984
187.317K
+12.058K
6.88%
jan 1, 1985
197.441K
+10.124K
5.4%
jan 1, 1986
191.168K
-6.273K
-3.18%
jan 1, 1987
194.95K
+3.782K
1.98%
jan 1, 1988
221.009K
+26.059K
13.37%
jan 1, 1989
235.634K
+14.625K
6.62%
jan 1, 1990
242.687K
+7.053K
2.99%
jan 1, 1991
253.402K
+10.715K
4.42%
jan 1, 1992
255.783K
+2.381K
0.94%
jan 1, 1993
260.843K
+5.06K
1.98%
jan 1, 1994
251.864K
-8.979K
-3.44%
jan 1, 1995
263.731K
+11.867K
4.71%
jan 1, 1996
300.636K
+36.905K
13.99%
jan 1, 1997
312.654K
+12.018K
4.0%
jan 1, 1998
290.726K
-21.928K
-7.01%
jan 1, 1999
296.848K
+6.122K
2.11%
jan 1, 2000
308.21K
+11.362K
3.83%
jan 1, 2001
303.561K
-4.65K
-1.51%
jan 1, 2002
306.254K
+2.694K
0.89%
jan 1, 2003
329.176K
+22.921K
7.48%
jan 1, 2004
323.015K
-6.161K
-1.87%
jan 1, 2005
342.5K
+19.485K
6.03%
jan 1, 2006
347.092K
+4.592K
1.34%
jan 1, 2007
358.356K
+11.264K
3.25%
jan 1, 2008
365.625K
+7.269K
2.03%
jan 1, 2009
375.436K
+9.811K
2.68%
Ranking of countries by current statistics by years


Comments: