30
/
AIzaSyAYiBZKx7MnpbEhh9jyipgxe19OcubqV5w
April 1, 2024
42241
Latin America & Caribbean (excluding high income)
LAC
false
2
1
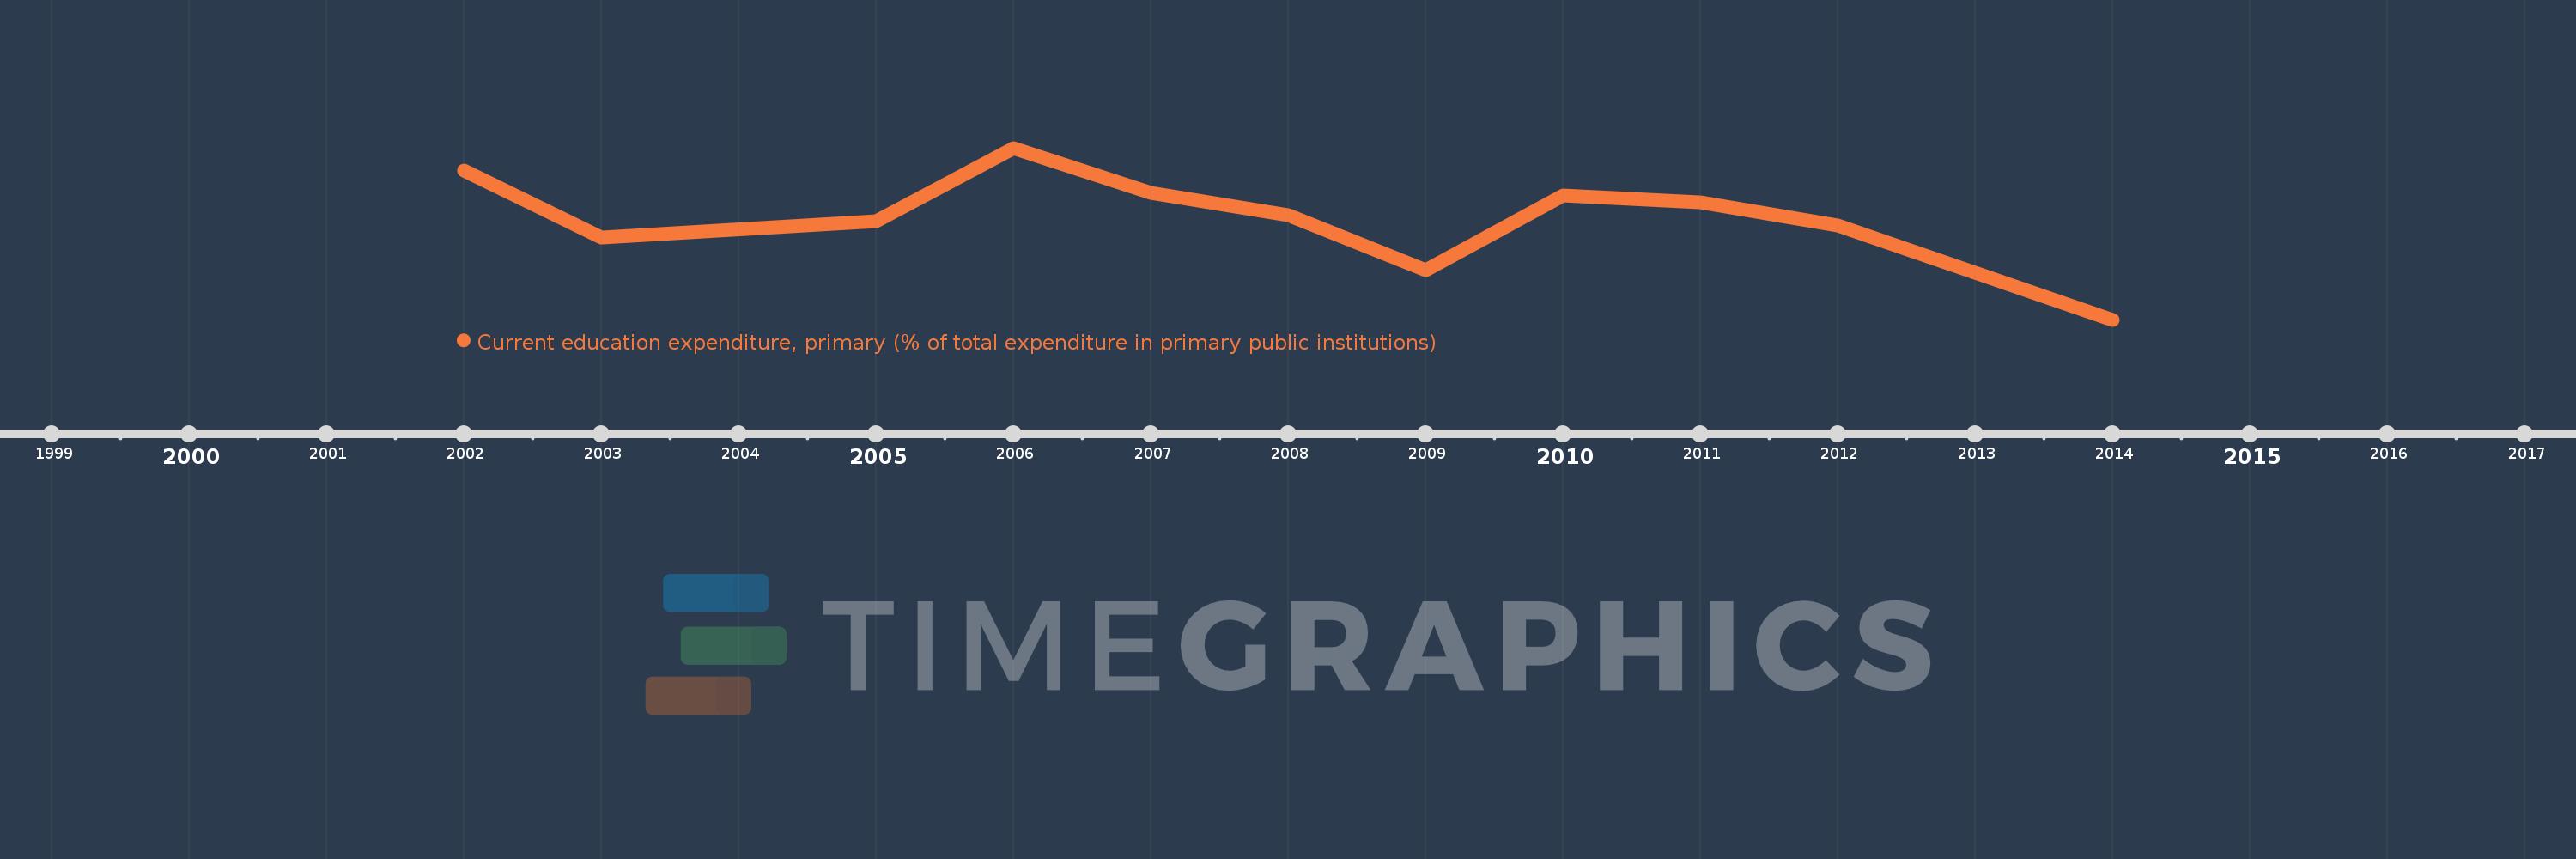
Current education expenditure, primary (% of total expenditure in primary public institutions)
2014,2012,2011,2010,2009,2008,2007,2006,2005,2003,2002
