29
/
en
AIzaSyAYiBZKx7MnpbEhh9jyipgxe19OcubqV5w
April 1, 2024
198945
Mongolia
MNG
true
2
1
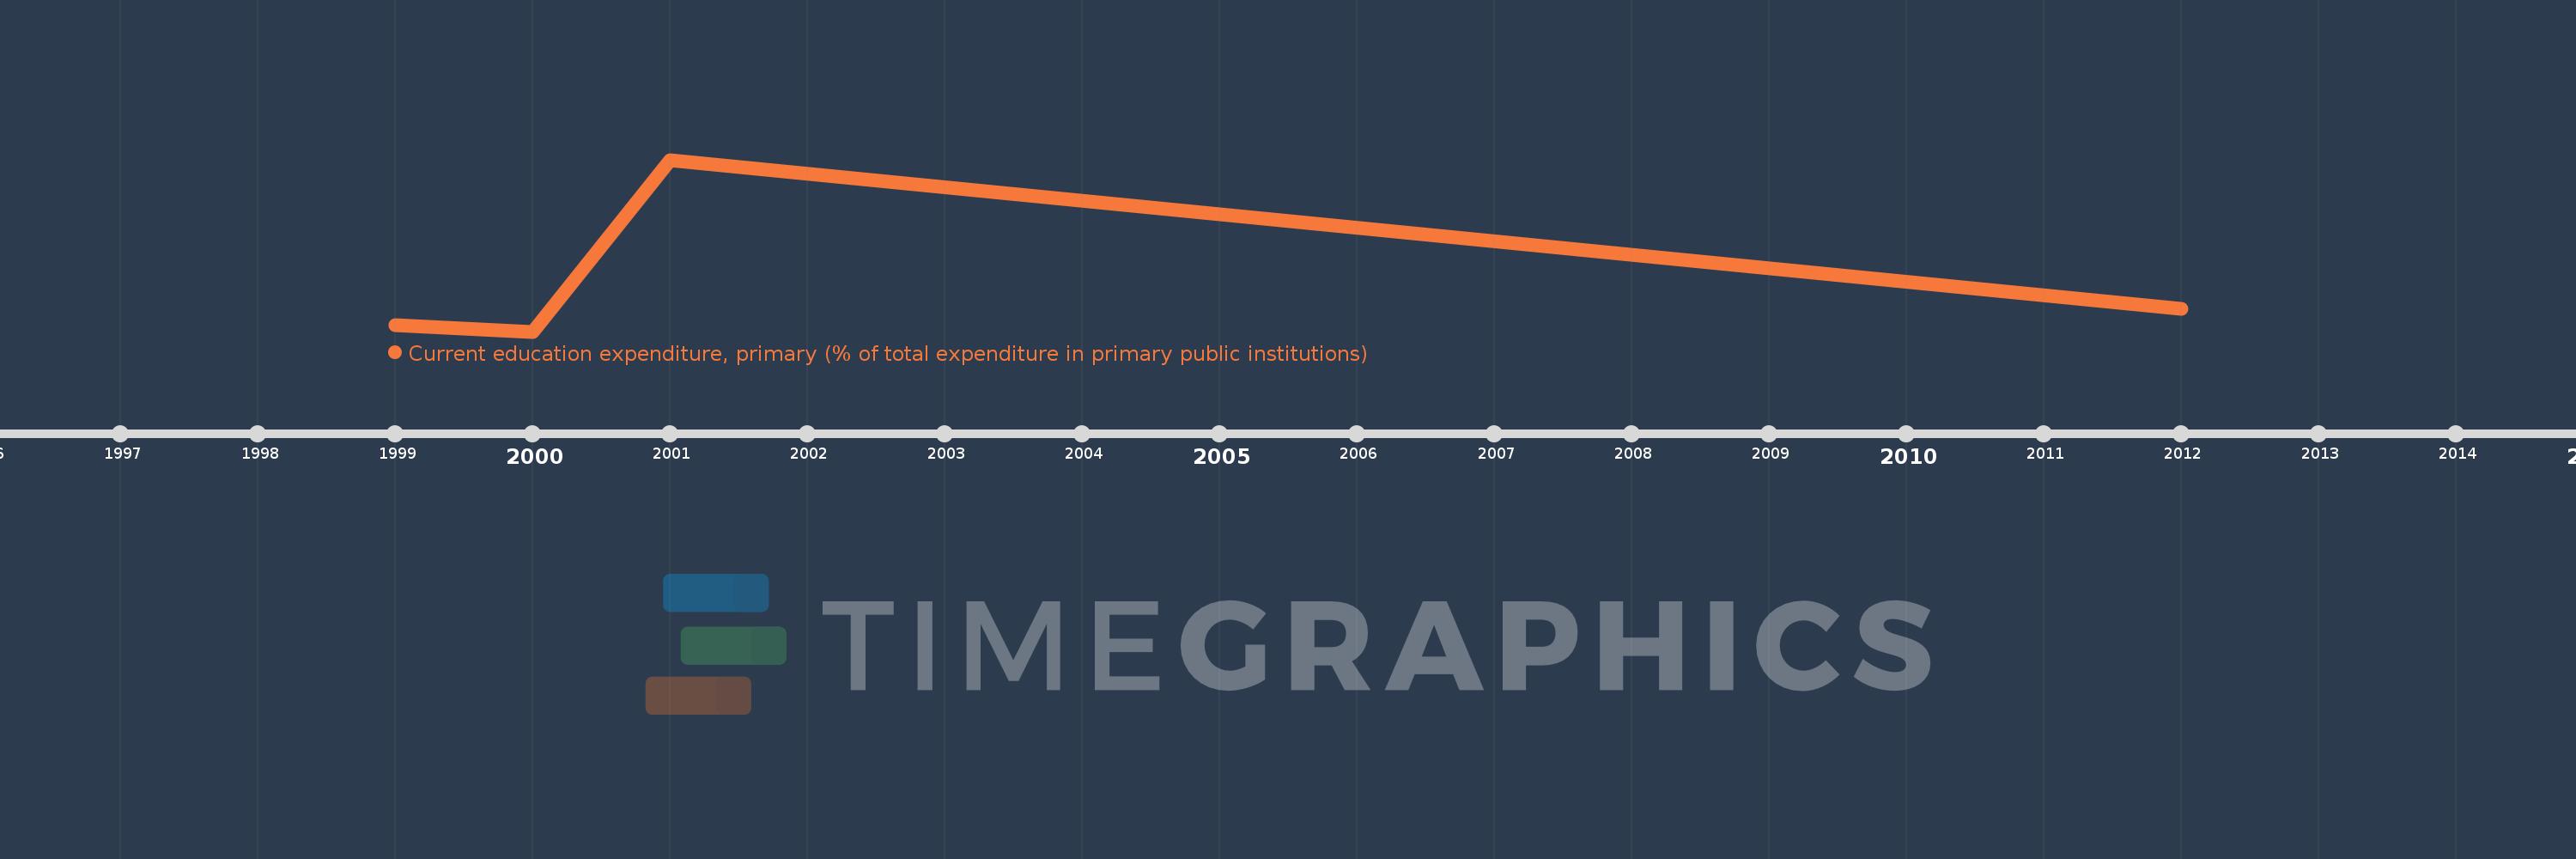
Current education expenditure, primary (% of total expenditure in primary public institutions)
2012,2001,2000,1999
This statistics in other country:
Timeline:
This timeline shows a graph from 1999 to 2012 of Mongolia. No data until 1998. Number of actual observations by date: 4.
Source name:
World Development Indicators
Source organization:
United Nations Educational, Scientific, and Cultural Organization (UNESCO) Institute for Statistics.
Categories, topics:
Education
Last updated:
apr 23, 2017
Indicators value changes by year
Minimum:
99.269
jan 1, 2000
At the date of observation
Value
Absolute change
Change from previous value
jan 1, 1999
99.29
+99.29
0.0%
jan 1, 2000
99.269
-0.021
-0.02%
jan 1, 2001
99.8
+0.53
0.53%
jan 1, 2012
99.34
-0.46
-0.46%
Ranking of countries by current statistics by years


Comments: