29
/
en
AIzaSyAYiBZKx7MnpbEhh9jyipgxe19OcubqV5w
April 1, 2024
112056
Costa Rica
CRI
true
2
1
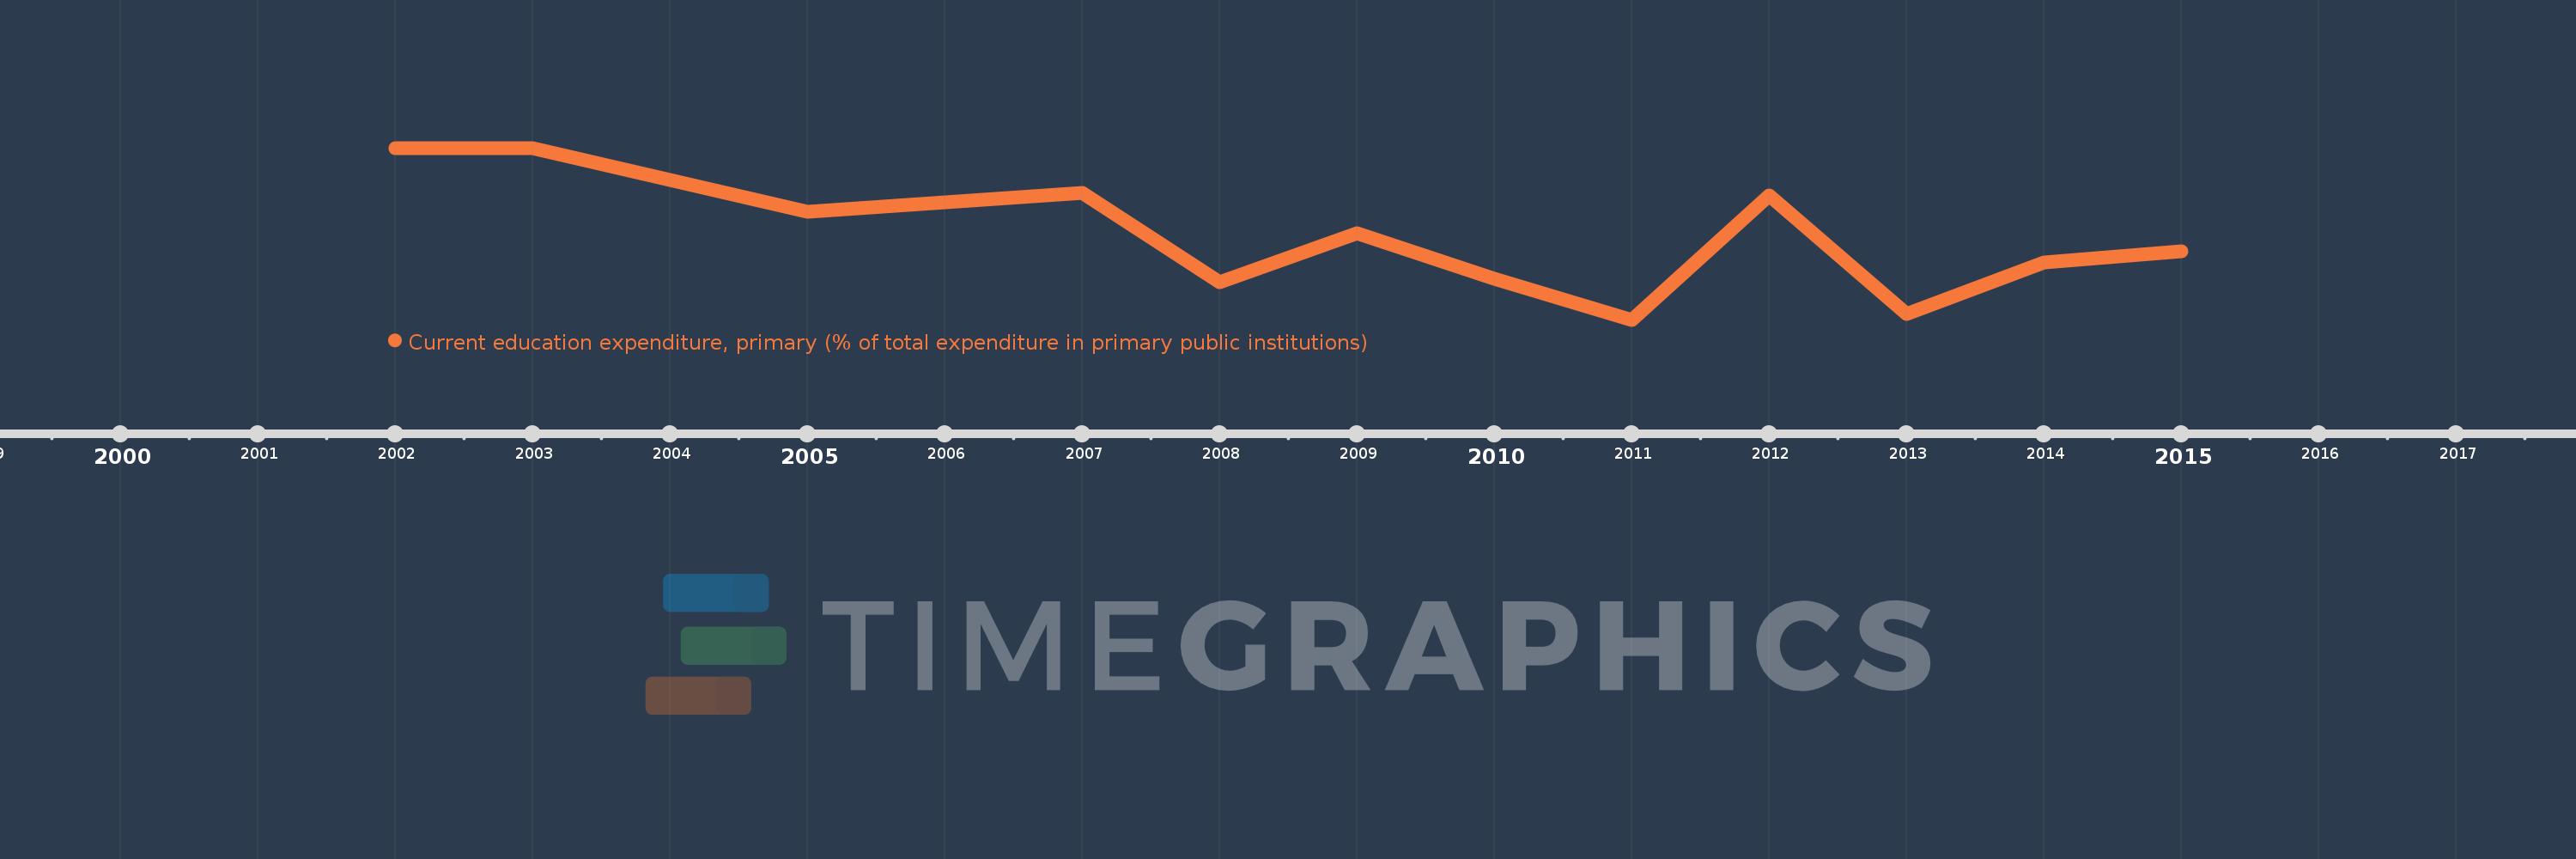
Current education expenditure, primary (% of total expenditure in primary public institutions)
2015,2014,2013,2012,2011,2010,2009,2008,2007,2005,2003,2002
This statistics in other country:
Timeline:
This timeline shows a graph from 2002 to 2015 of Costa Rica. No data until 2001. Number of actual observations by date: 12.
Source name:
World Development Indicators
Source organization:
United Nations Educational, Scientific, and Cultural Organization (UNESCO) Institute for Statistics.
Categories, topics:
Education
Last updated:
apr 23, 2017
Indicators value changes by year
Minimum:
92.643
jan 1, 2011
At the date of observation
Value
Absolute change
Change from previous value
jan 1, 2002
100.0
+100.0
0.0%
jan 1, 2003
100.0
0.0
0.0%
jan 1, 2005
97.251
-2.749
-2.75%
jan 1, 2007
98.081
+0.83
0.85%
jan 1, 2008
94.259
-3.822
-3.9%
jan 1, 2009
96.337
+2.079
2.21%
jan 1, 2010
94.383
-1.954
-2.03%
jan 1, 2011
92.643
-1.741
-1.84%
jan 1, 2012
97.968
+5.325
5.75%
jan 1, 2013
92.887
-5.081
-5.19%
jan 1, 2014
95.084
+2.196
2.36%
jan 1, 2015
95.586
+0.502
0.53%
Ranking of countries by current statistics by years


Comments: