29
/
en
AIzaSyAYiBZKx7MnpbEhh9jyipgxe19OcubqV5w
April 1, 2024
251764
St. Vincent and the Grenadines
VCT
true
2
1
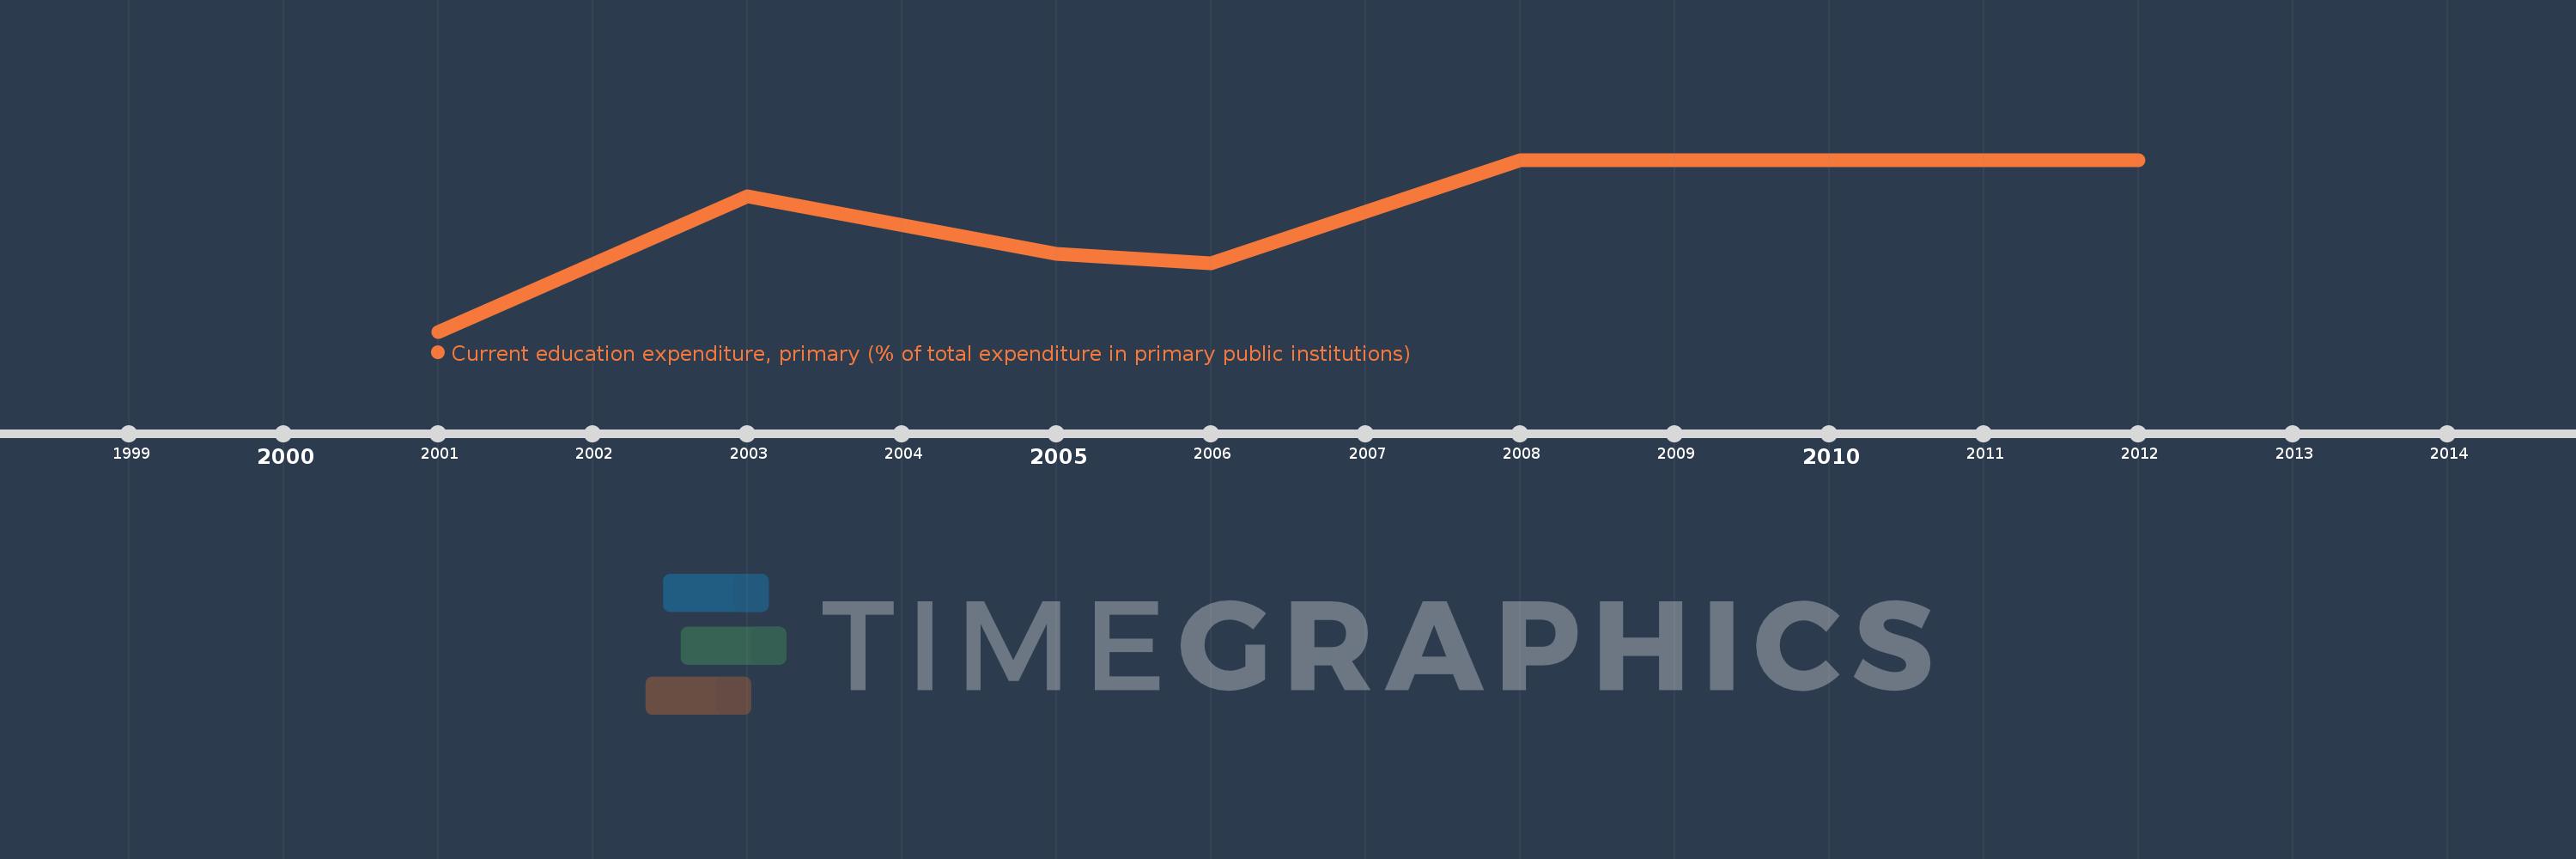
Current education expenditure, primary (% of total expenditure in primary public institutions)
2012,2011,2010,2008,2006,2005,2003,2001
This statistics in other country:
Timeline:
This timeline shows a graph from 2001 to 2012 of St. Vincent and the Grenadines. No data until 2000. Number of actual observations by date: 8.
Source name:
World Development Indicators
Source organization:
United Nations Educational, Scientific, and Cultural Organization (UNESCO) Institute for Statistics.
Categories, topics:
Education
Last updated:
apr 23, 2017
Indicators value changes by year
At the date of observation
Value
Absolute change
Change from previous value
jan 1, 2001
71.15
+71.15
0.0%
jan 1, 2003
93.826
+22.676
31.87%
jan 1, 2005
84.273
-9.553
-10.18%
jan 1, 2006
82.559
-1.714
-2.03%
jan 1, 2008
100.0
+17.441
21.13%
jan 1, 2010
100.0
0.0
0.0%
jan 1, 2011
100.0
0.0
0.0%
jan 1, 2012
100.0
0.0
0.0%
Ranking of countries by current statistics by years


Comments: