29
/
en
AIzaSyAYiBZKx7MnpbEhh9jyipgxe19OcubqV5w
April 1, 2024
160329
Israel
ISR
true
2
1
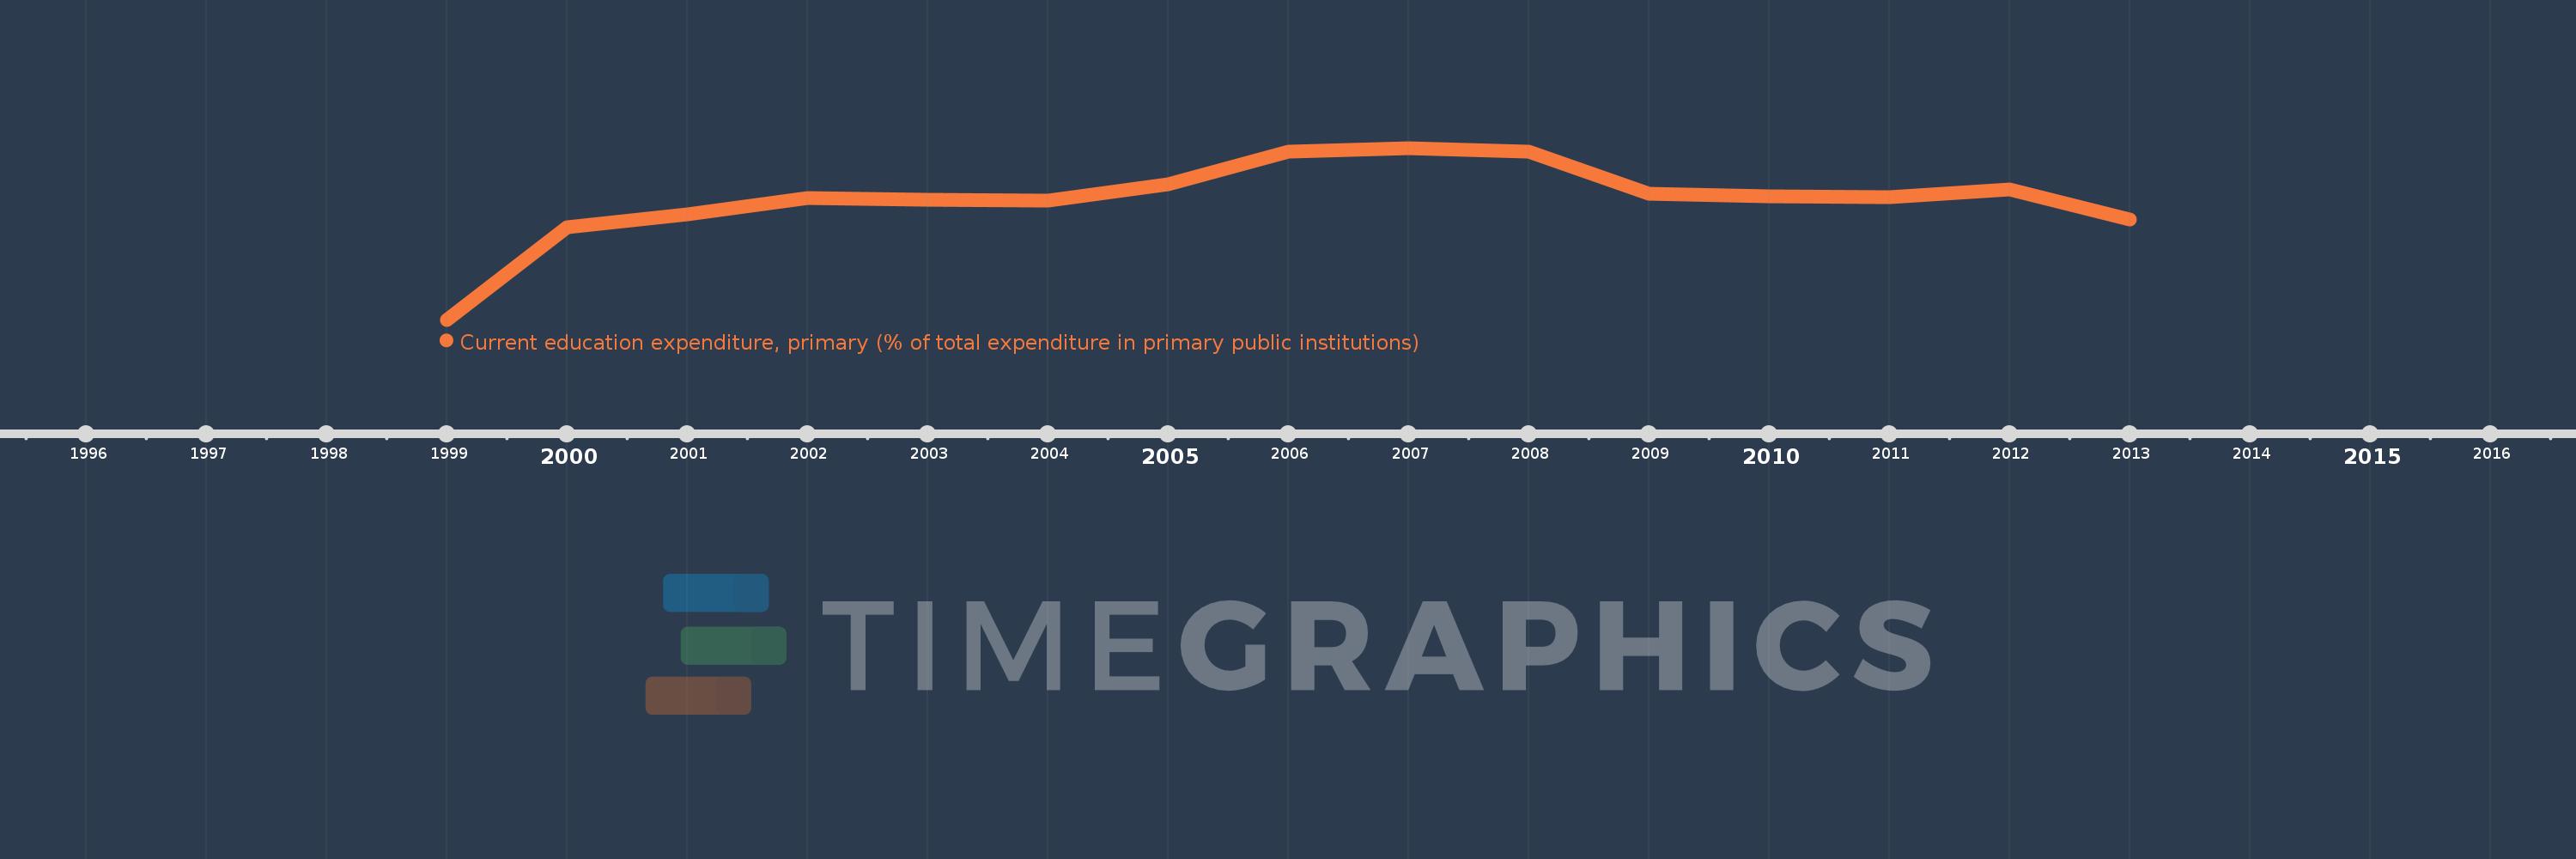
Current education expenditure, primary (% of total expenditure in primary public institutions)
2013,2012,2011,2010,2009,2008,2007,2006,2005,2004,2003,2002,2001,2000,1999
This statistics in other country:
Timeline:
This timeline shows a graph from 1999 to 2013 of Israel. No data until 1998. Number of actual observations by date: 15.
Source name:
World Development Indicators
Source organization:
United Nations Educational, Scientific, and Cultural Organization (UNESCO) Institute for Statistics.
Categories, topics:
Education
Last updated:
apr 23, 2017
Indicators value changes by year
Minimum:
84.913
jan 1, 1999
Maximum:
92.245
jan 1, 2007
At the date of observation
Value
Absolute change
Change from previous value
jan 1, 1999
84.913
+84.913
0.0%
jan 1, 2000
88.861
+3.948
4.65%
jan 1, 2001
89.407
+0.546
0.61%
jan 1, 2002
90.098
+0.692
0.77%
jan 1, 2003
90.035
-0.064
-0.07%
jan 1, 2004
89.992
-0.042
-0.05%
jan 1, 2005
90.698
+0.706
0.78%
jan 1, 2006
92.089
+1.391
1.53%
jan 1, 2007
92.245
+0.156
0.17%
jan 1, 2008
92.083
-0.162
-0.18%
jan 1, 2009
90.281
-1.803
-1.96%
jan 1, 2010
90.198
-0.082
-0.09%
jan 1, 2011
90.148
-0.05
-0.06%
jan 1, 2012
90.463
+0.315
0.35%
jan 1, 2013
89.184
-1.28
-1.41%
Ranking of countries by current statistics by years


Comments: