29
/
en
AIzaSyAYiBZKx7MnpbEhh9jyipgxe19OcubqV5w
April 1, 2024
195360
Mexico
MEX
true
2
1
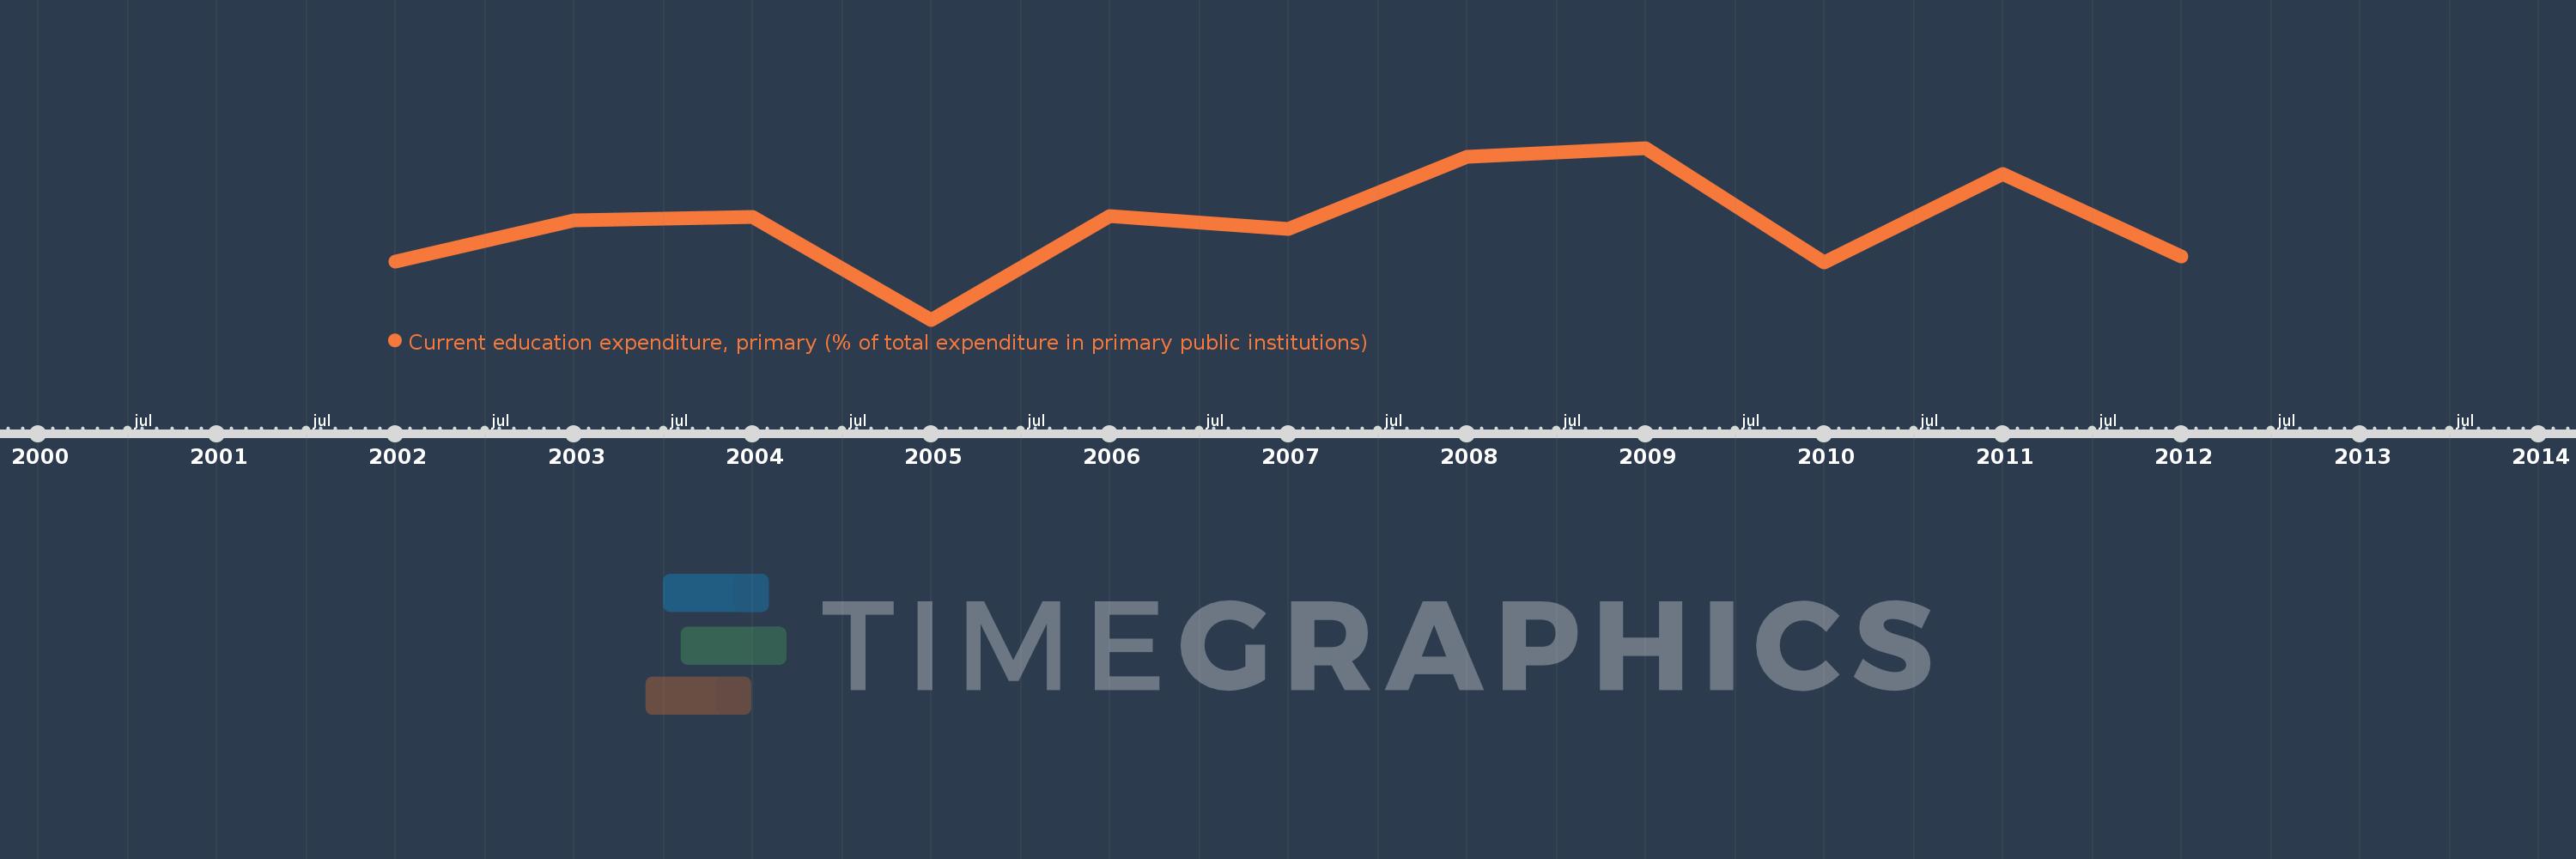
Current education expenditure, primary (% of total expenditure in primary public institutions)
2012,2011,2010,2009,2008,2007,2006,2005,2004,2003,2002
This statistics in other country:
Timeline:
This timeline shows a graph from 2002 to 2012 of Mexico. No data until 2001. Number of actual observations by date: 11.
Source name:
World Development Indicators
Source organization:
United Nations Educational, Scientific, and Cultural Organization (UNESCO) Institute for Statistics.
Categories, topics:
Education
Last updated:
apr 23, 2017
Indicators value changes by year
Minimum:
96.987
jan 1, 2005
Maximum:
98.112
jan 1, 2009
At the date of observation
Value
Absolute change
Change from previous value
jan 1, 2002
97.367
+97.367
0.0%
jan 1, 2003
97.637
+0.269
0.28%
jan 1, 2004
97.661
+0.024
0.02%
jan 1, 2005
96.987
-0.673
-0.69%
jan 1, 2006
97.667
+0.68
0.7%
jan 1, 2007
97.584
-0.083
-0.09%
jan 1, 2008
98.053
+0.469
0.48%
jan 1, 2009
98.112
+0.06
0.06%
jan 1, 2010
97.361
-0.751
-0.77%
jan 1, 2011
97.941
+0.58
0.6%
jan 1, 2012
97.404
-0.538
-0.55%
Ranking of countries by current statistics by years


Comments: