29
/
en
AIzaSyAYiBZKx7MnpbEhh9jyipgxe19OcubqV5w
April 1, 2024
161318
Italy
ITA
true
2
1
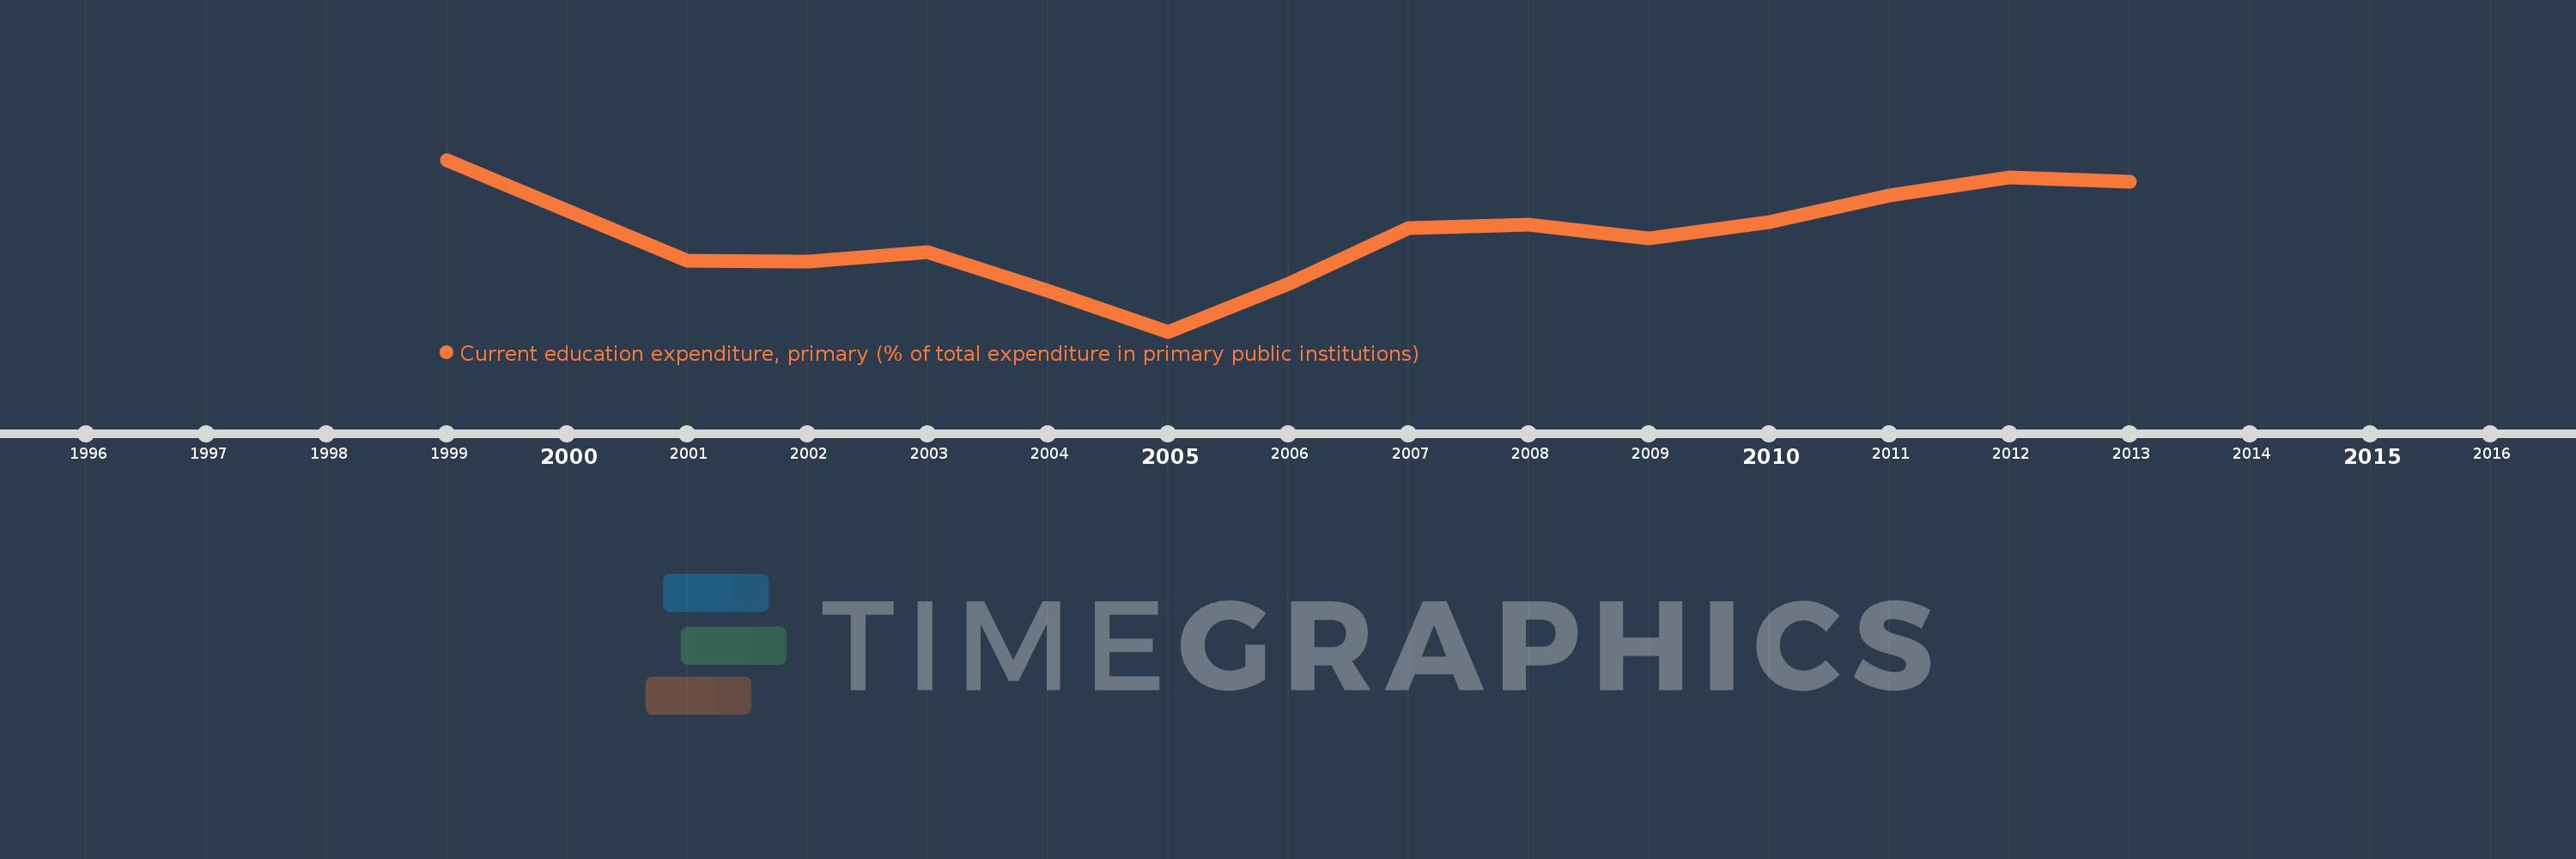
Current education expenditure, primary (% of total expenditure in primary public institutions)
2013,2012,2011,2010,2009,2008,2007,2006,2005,2004,2003,2002,2001,1999
This statistics in other country:
Timeline:
This timeline shows a graph from 1999 to 2013 of Italy. No data until 1998. Number of actual observations by date: 14.
Source name:
World Development Indicators
Source organization:
United Nations Educational, Scientific, and Cultural Organization (UNESCO) Institute for Statistics.
Categories, topics:
Education
Last updated:
apr 23, 2017
Indicators value changes by year
Minimum:
92.234
jan 1, 2005
Maximum:
97.054
jan 1, 1999
At the date of observation
Value
Absolute change
Change from previous value
jan 1, 1999
97.054
+97.054
0.0%
jan 1, 2001
94.212
-2.842
-2.93%
jan 1, 2002
94.198
-0.014
-0.02%
jan 1, 2003
94.464
+0.267
0.28%
jan 1, 2004
93.369
-1.095
-1.16%
jan 1, 2005
92.234
-1.136
-1.22%
jan 1, 2006
93.571
+1.337
1.45%
jan 1, 2007
95.137
+1.567
1.67%
jan 1, 2008
95.226
+0.089
0.09%
jan 1, 2009
94.851
-0.376
-0.39%
jan 1, 2010
95.318
+0.467
0.49%
jan 1, 2011
96.065
+0.748
0.78%
jan 1, 2012
96.568
+0.502
0.52%
jan 1, 2013
96.447
-0.12
-0.12%
Ranking of countries by current statistics by years


Comments: