29
/
en
AIzaSyAYiBZKx7MnpbEhh9jyipgxe19OcubqV5w
April 1, 2024
118757
Denmark
DNK
true
2
1
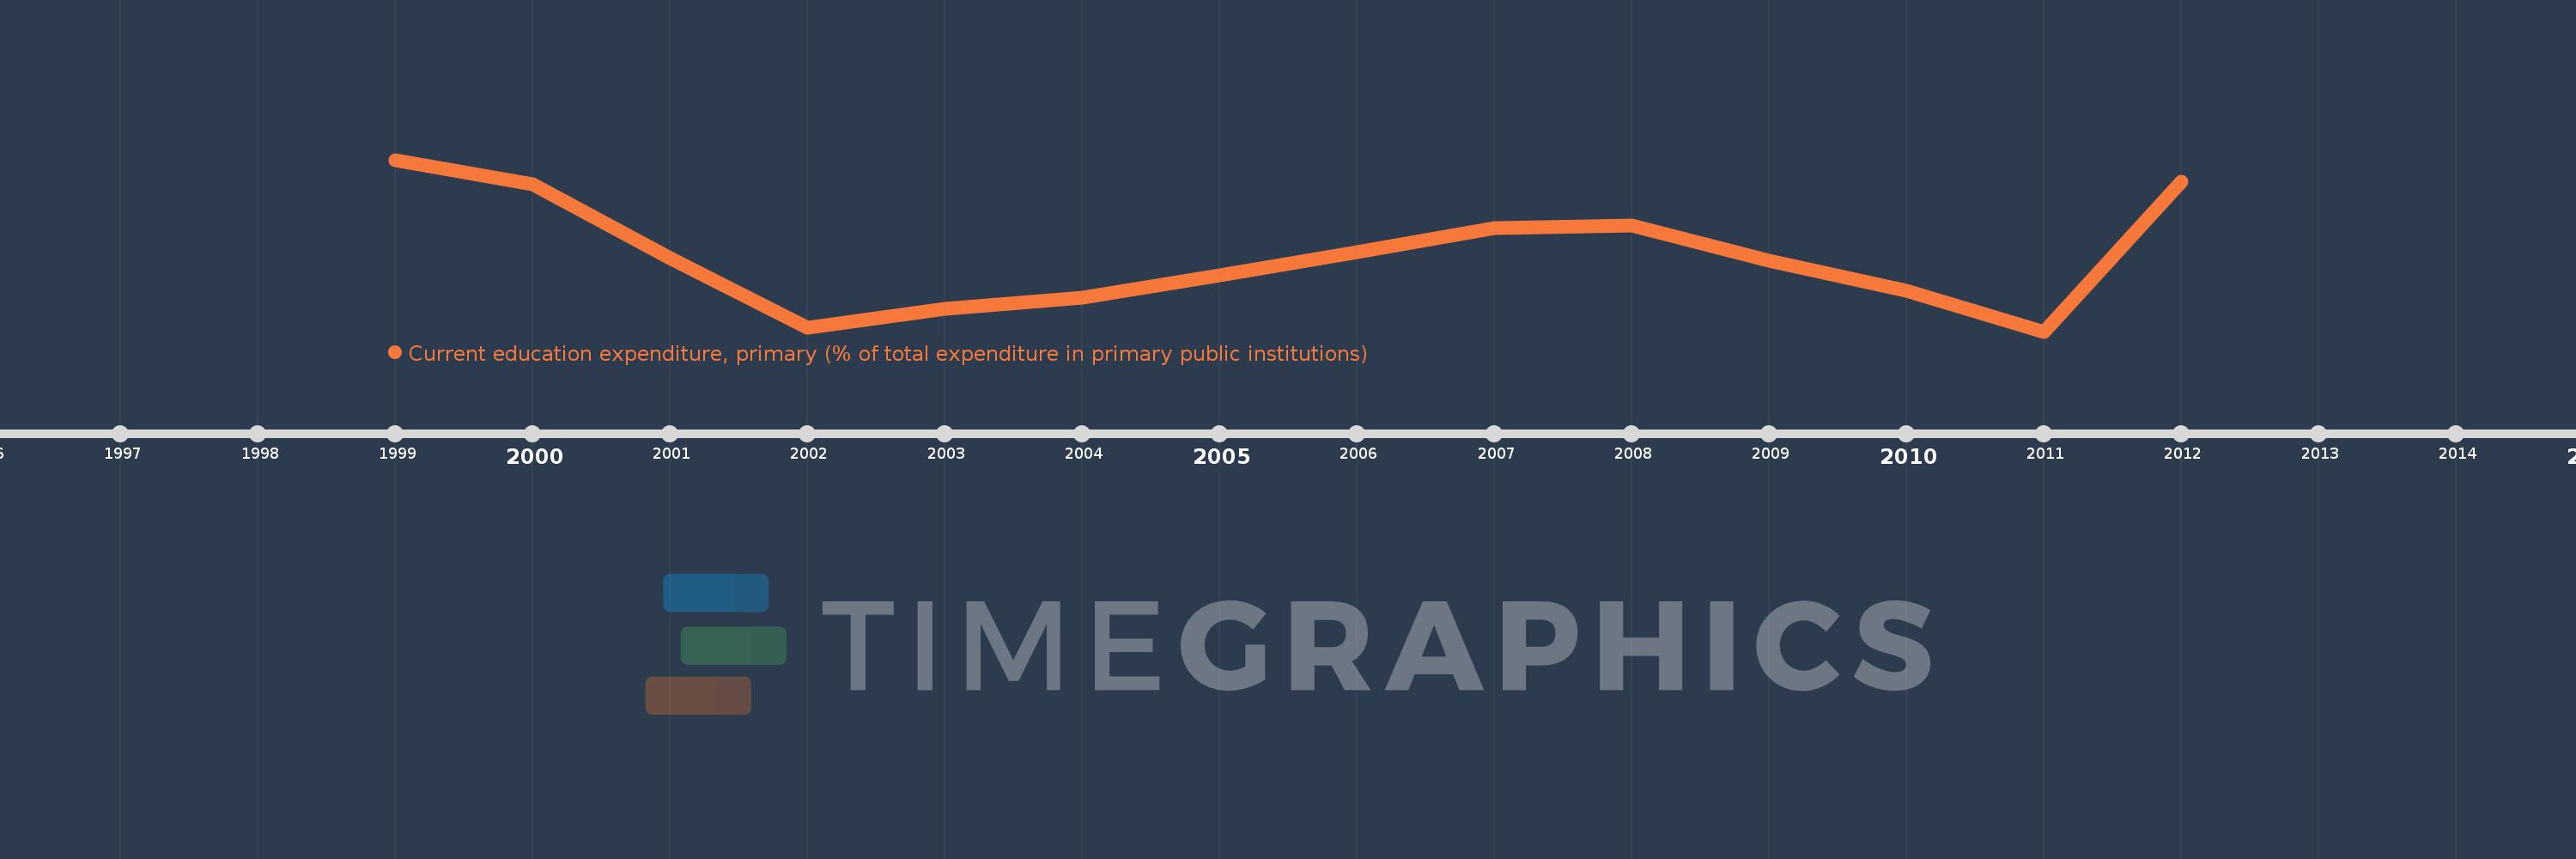
Current education expenditure, primary (% of total expenditure in primary public institutions)
2012,2011,2010,2009,2008,2007,2006,2005,2004,2003,2002,2001,2000,1999
This statistics in other country:
Timeline:
This timeline shows a graph from 1999 to 2012 of Denmark. No data until 1998. Number of actual observations by date: 14.
Source name:
World Development Indicators
Source organization:
United Nations Educational, Scientific, and Cultural Organization (UNESCO) Institute for Statistics.
Categories, topics:
Education
Last updated:
apr 23, 2017
Indicators value changes by year
Minimum:
89.247
jan 1, 2011
Maximum:
95.424
jan 1, 1999
At the date of observation
Value
Absolute change
Change from previous value
jan 1, 1999
95.424
+95.424
0.0%
jan 1, 2000
94.55
-0.874
-0.92%
jan 1, 2001
91.892
-2.658
-2.81%
jan 1, 2002
89.378
-2.514
-2.74%
jan 1, 2003
90.057
+0.679
0.76%
jan 1, 2004
90.472
+0.416
0.46%
jan 1, 2005
91.271
+0.799
0.88%
jan 1, 2006
92.092
+0.82
0.9%
jan 1, 2007
92.974
+0.883
0.96%
jan 1, 2008
93.07
+0.096
0.1%
jan 1, 2009
91.788
-1.282
-1.38%
jan 1, 2010
90.719
-1.068
-1.16%
jan 1, 2011
89.247
-1.472
-1.62%
jan 1, 2012
94.646
+5.398
6.05%
Ranking of countries by current statistics by years


Comments: