29
/
en
AIzaSyAYiBZKx7MnpbEhh9jyipgxe19OcubqV5w
April 1, 2024
54672
Post-demographic dividend
PST
false
2
1
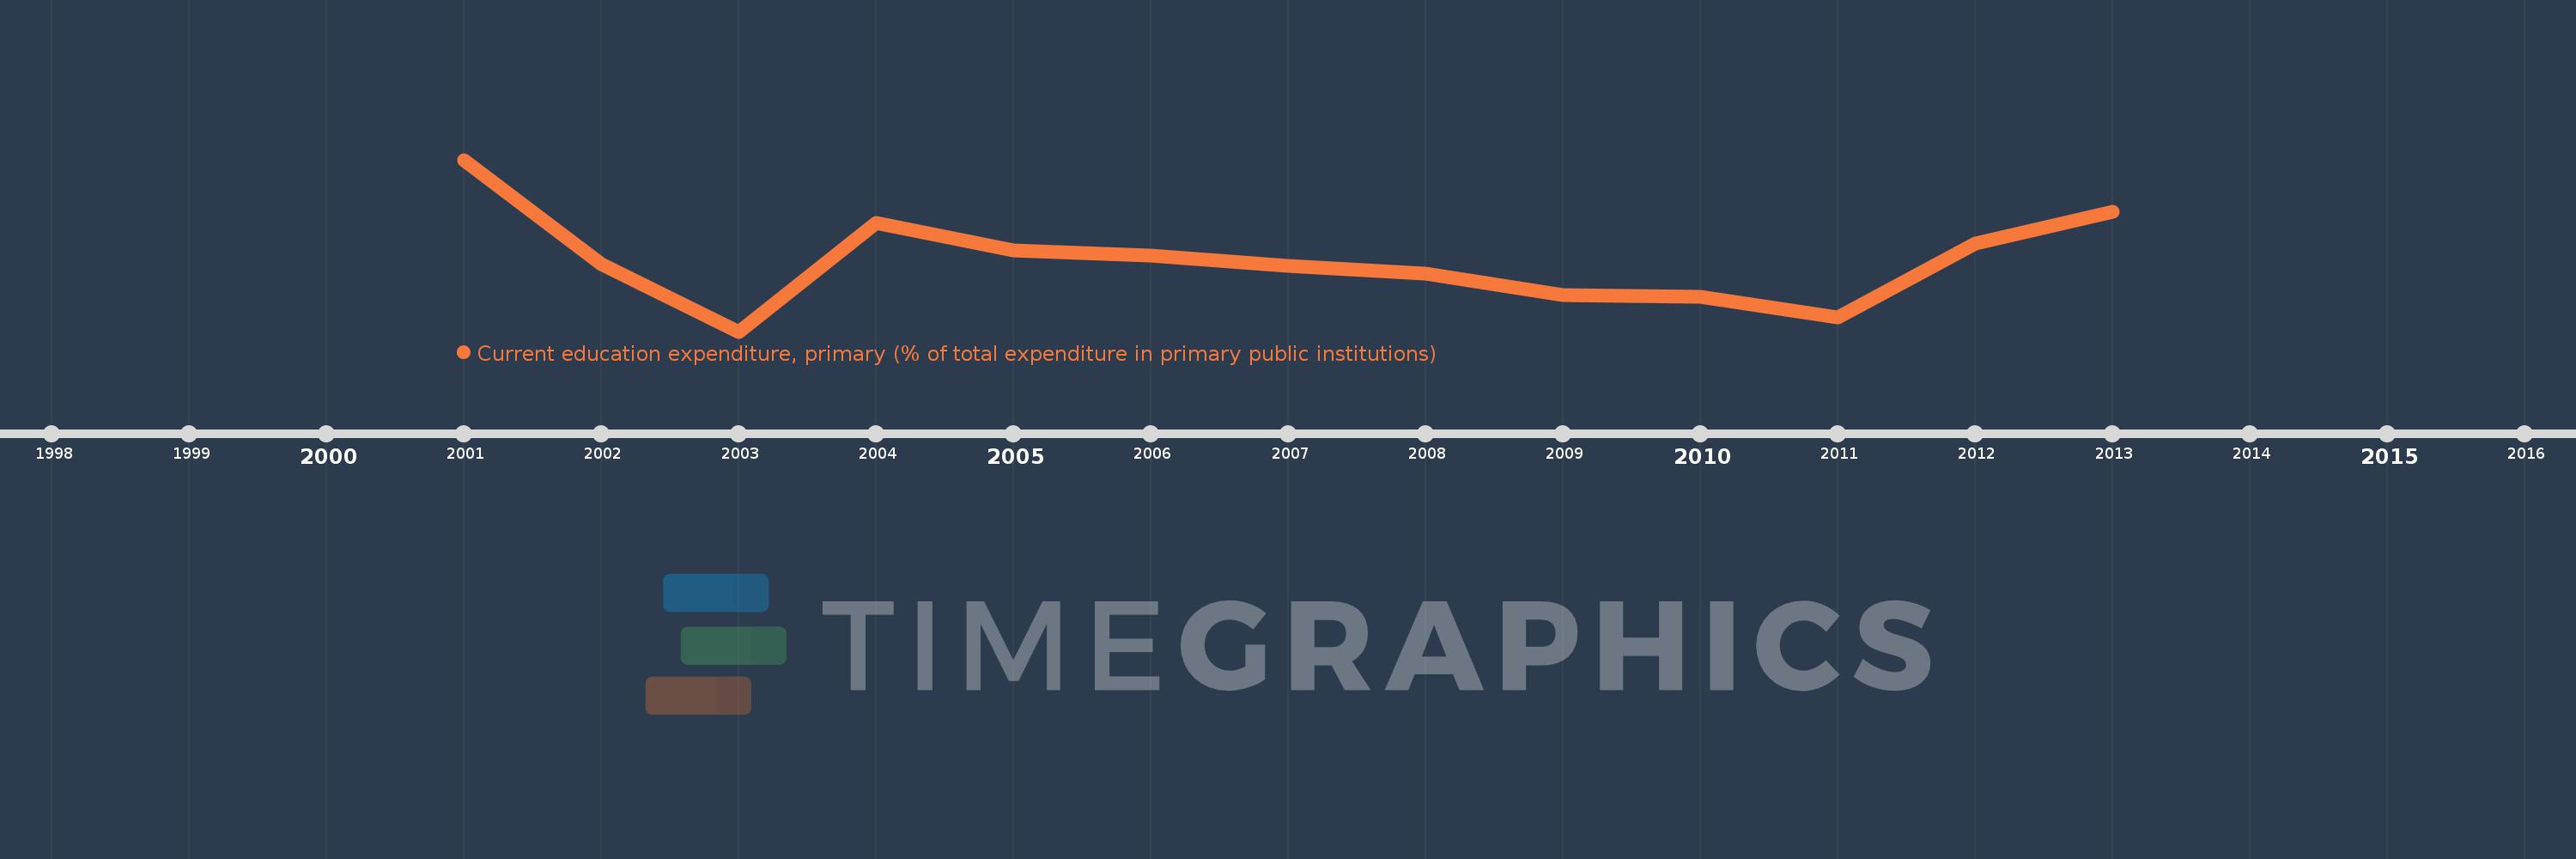
Current education expenditure, primary (% of total expenditure in primary public institutions)
2013,2012,2011,2010,2009,2008,2007,2006,2005,2004,2003,2002,2001
This statistics in other country:
Timeline:
This timeline shows a graph from 2001 to 2013 of Post-demographic dividend. No data until 2000. Number of actual observations by date: 13.
Source name:
World Development Indicators
Source organization:
United Nations Educational, Scientific, and Cultural Organization (UNESCO) Institute for Statistics.
Categories, topics:
Education
Last updated:
apr 23, 2017
Indicators value changes by year
Minimum:
90.415
jan 1, 2003
Maximum:
94.212
jan 1, 2001
At the date of observation
Value
Absolute change
Change from previous value
jan 1, 2001
94.212
+94.212
0.0%
jan 1, 2002
91.897
-2.315
-2.46%
jan 1, 2003
90.415
-1.481
-1.61%
jan 1, 2004
92.822
+2.407
2.66%
jan 1, 2005
92.209
-0.613
-0.66%
jan 1, 2006
92.092
-0.118
-0.13%
jan 1, 2007
91.863
-0.229
-0.25%
jan 1, 2008
91.691
-0.172
-0.19%
jan 1, 2009
91.213
-0.478
-0.52%
jan 1, 2010
91.185
-0.028
-0.03%
jan 1, 2011
90.727
-0.459
-0.5%
jan 1, 2012
92.359
+1.632
1.8%
jan 1, 2013
93.063
+0.704
0.76%
Ranking of countries by current statistics by years


Comments: