29
/
en
AIzaSyAYiBZKx7MnpbEhh9jyipgxe19OcubqV5w
April 1, 2024
257153
Switzerland
CHE
true
2
1
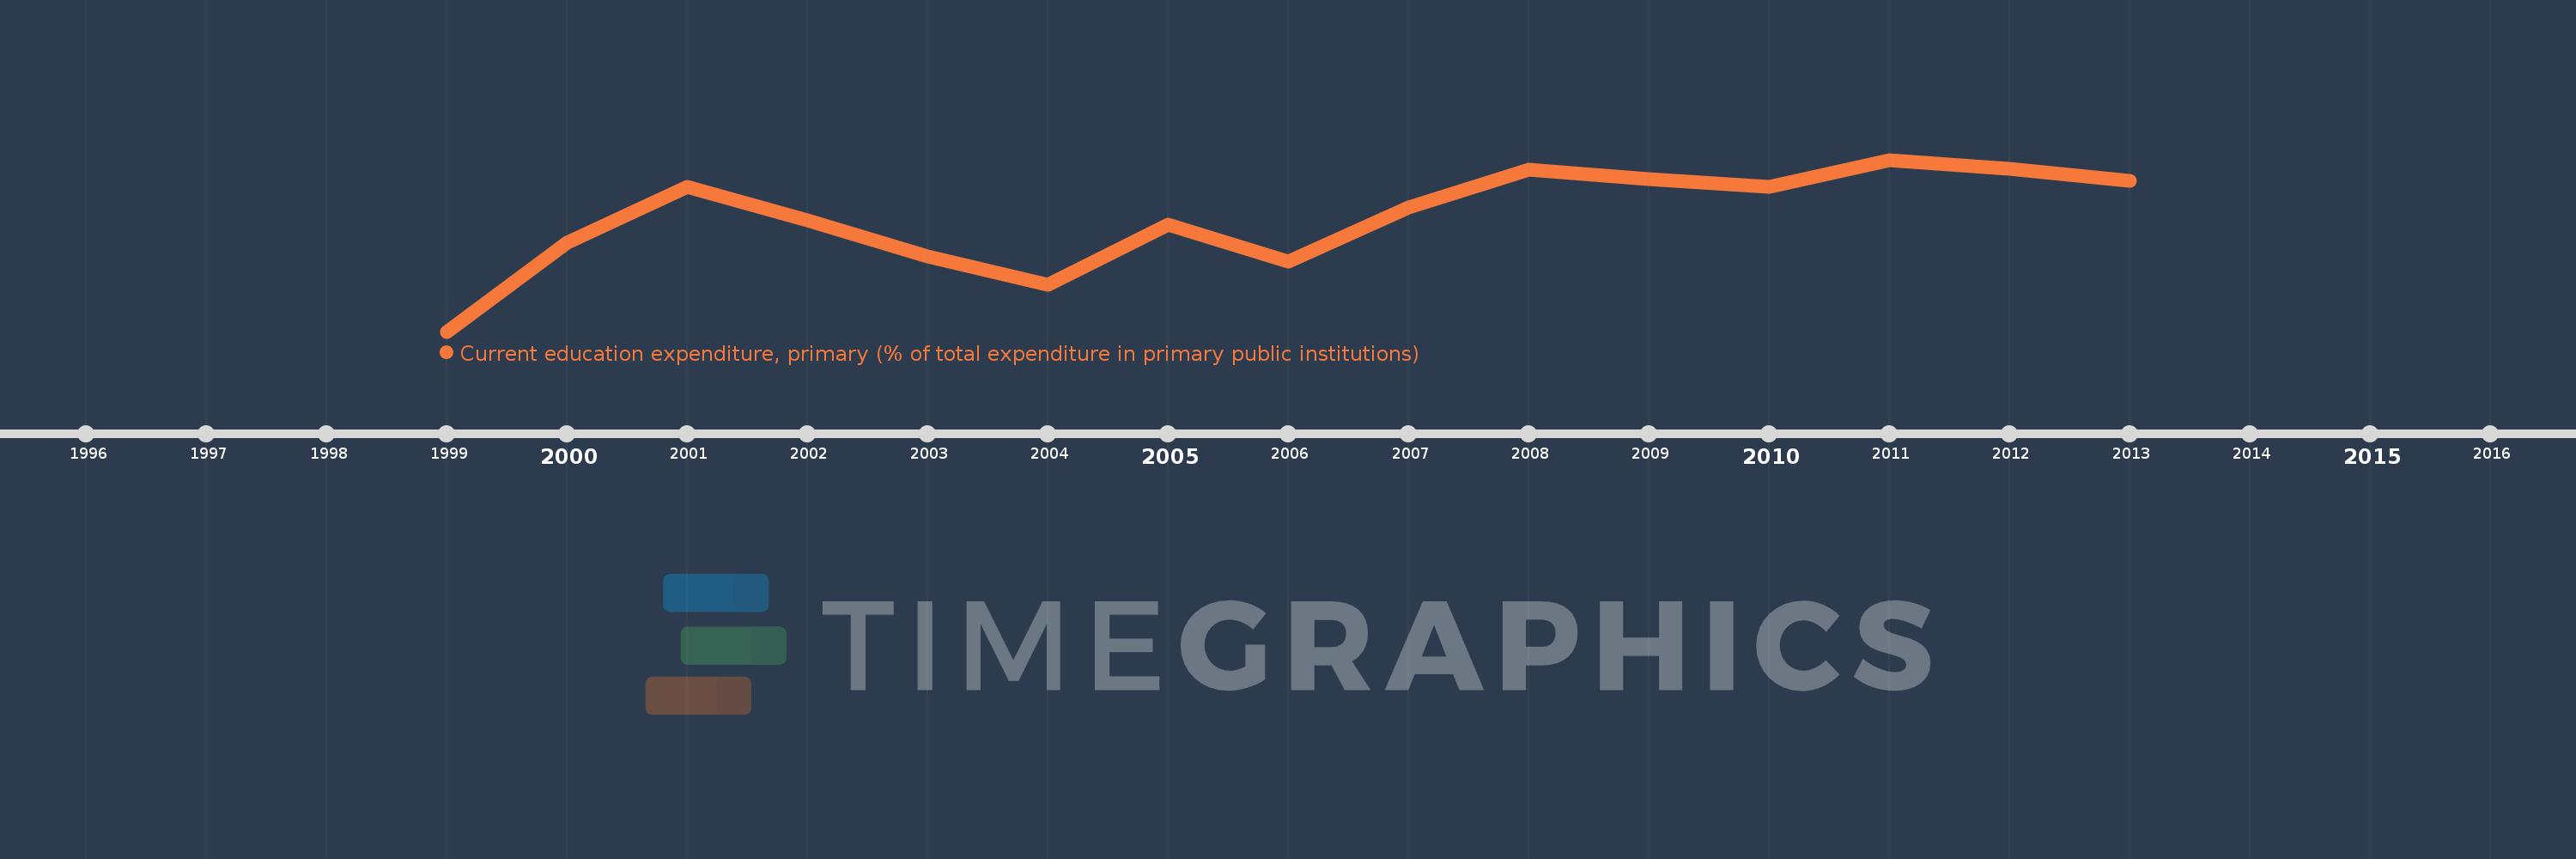
Current education expenditure, primary (% of total expenditure in primary public institutions)
2013,2012,2011,2010,2009,2008,2007,2006,2005,2004,2003,2002,2001,2000,1999
This statistics in other country:
Timeline:
This timeline shows a graph from 1999 to 2013 of Switzerland. No data until 1998. Number of actual observations by date: 15.
Source name:
World Development Indicators
Source organization:
United Nations Educational, Scientific, and Cultural Organization (UNESCO) Institute for Statistics.
Categories, topics:
Education
Last updated:
apr 23, 2017
Indicators value changes by year
Minimum:
87.078
jan 1, 1999
Maximum:
90.727
jan 1, 2011
At the date of observation
Value
Absolute change
Change from previous value
jan 1, 1999
87.078
+87.078
0.0%
jan 1, 2000
88.971
+1.893
2.17%
jan 1, 2001
90.156
+1.185
1.33%
jan 1, 2002
89.445
-0.711
-0.79%
jan 1, 2003
88.683
-0.763
-0.85%
jan 1, 2004
88.081
-0.602
-0.68%
jan 1, 2005
89.348
+1.267
1.44%
jan 1, 2006
88.565
-0.783
-0.88%
jan 1, 2007
89.708
+1.142
1.29%
jan 1, 2008
90.515
+0.807
0.9%
jan 1, 2009
90.318
-0.197
-0.22%
jan 1, 2010
90.145
-0.173
-0.19%
jan 1, 2011
90.727
+0.581
0.64%
jan 1, 2012
90.535
-0.191
-0.21%
jan 1, 2013
90.278
-0.257
-0.28%
Ranking of countries by current statistics by years


Comments: