29
/
en
AIzaSyAYiBZKx7MnpbEhh9jyipgxe19OcubqV5w
April 1, 2024
225738
Portugal
PRT
true
2
1
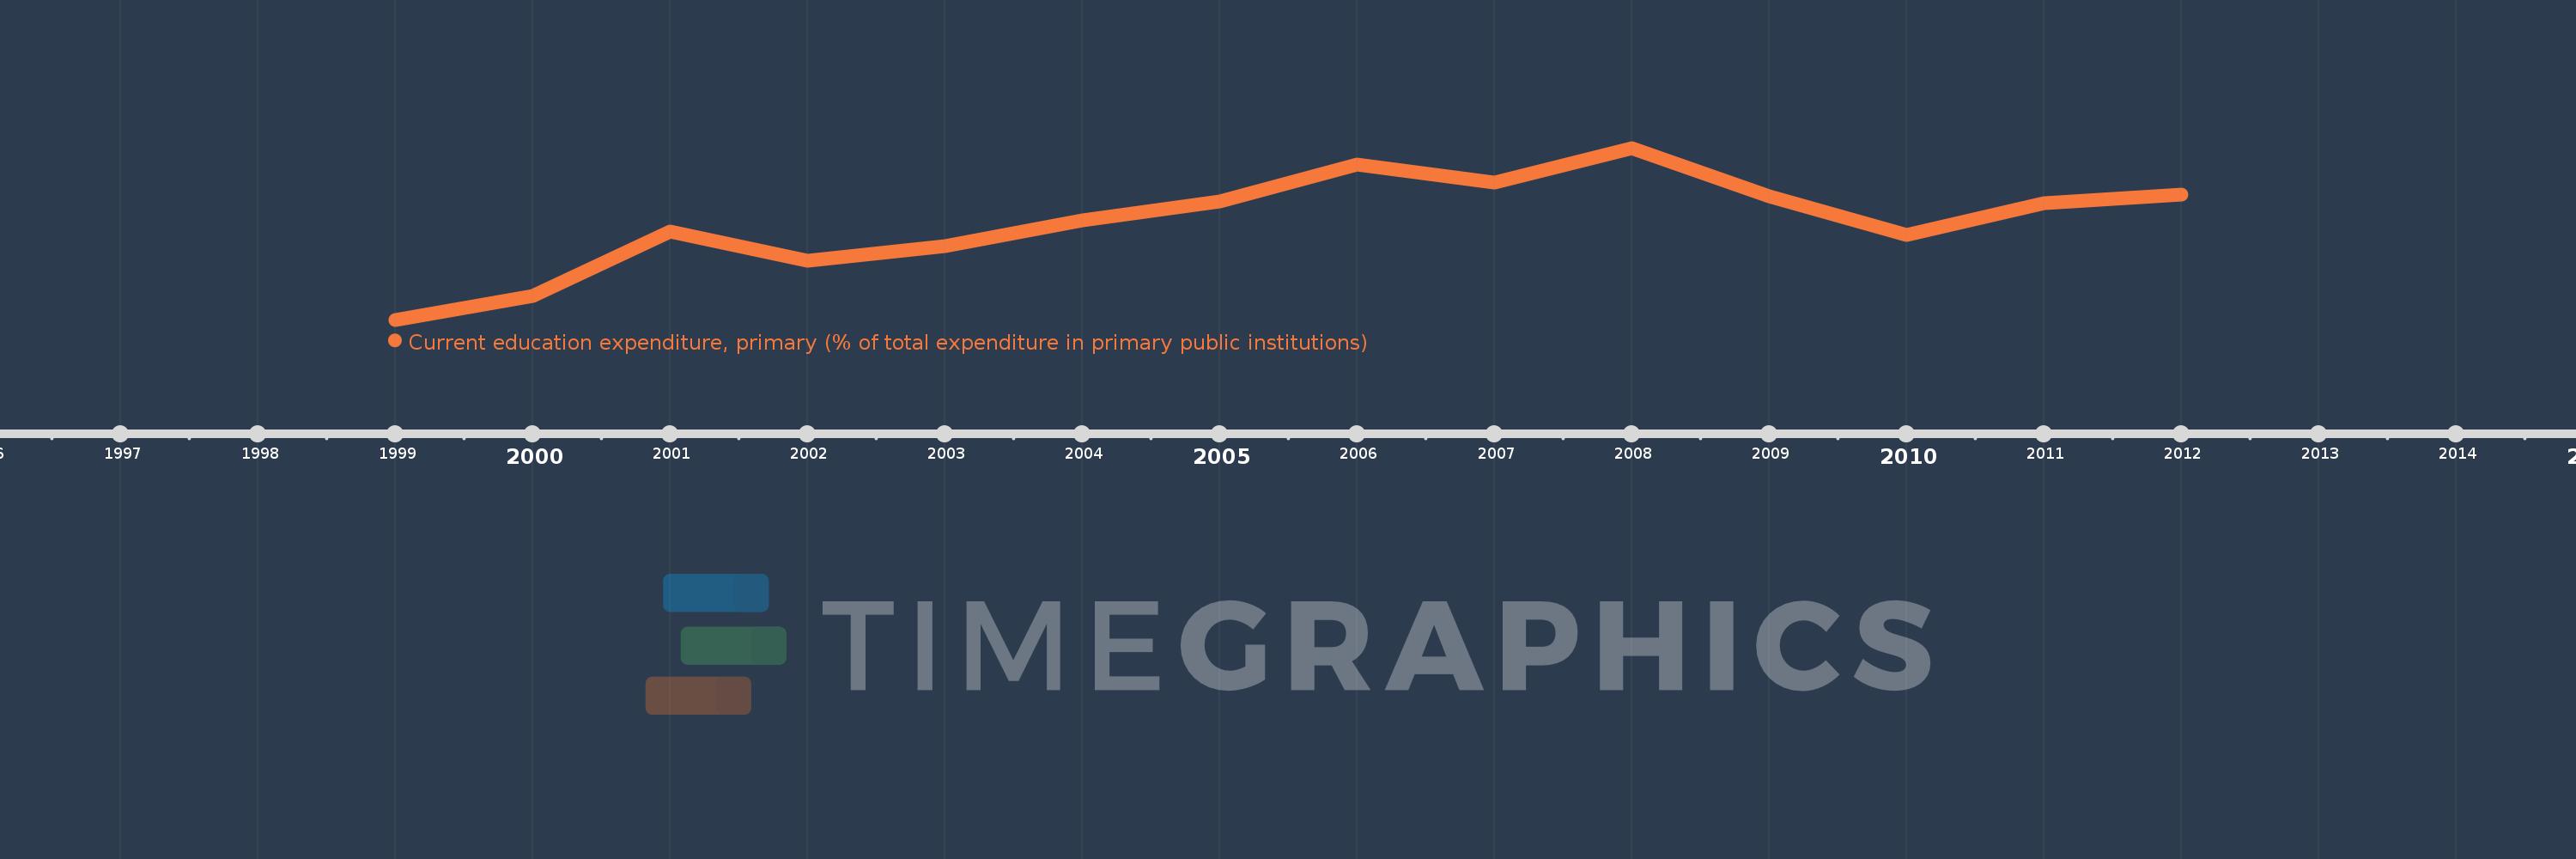
Current education expenditure, primary (% of total expenditure in primary public institutions)
2012,2011,2010,2009,2008,2007,2006,2005,2004,2003,2002,2001,2000,1999
This statistics in other country:
Timeline:
This timeline shows a graph from 1999 to 2012 of Portugal. No data until 1998. Number of actual observations by date: 14.
Source name:
World Development Indicators
Source organization:
United Nations Educational, Scientific, and Cultural Organization (UNESCO) Institute for Statistics.
Categories, topics:
Education
Last updated:
apr 23, 2017
Indicators value changes by year
Minimum:
96.844
jan 1, 1999
At the date of observation
Value
Absolute change
Change from previous value
jan 1, 1999
96.844
+96.844
0.0%
jan 1, 2000
97.187
+0.343
0.35%
jan 1, 2001
98.124
+0.936
0.96%
jan 1, 2002
97.697
-0.427
-0.44%
jan 1, 2003
97.905
+0.209
0.21%
jan 1, 2004
98.279
+0.373
0.38%
jan 1, 2005
98.555
+0.276
0.28%
jan 1, 2006
99.093
+0.538
0.55%
jan 1, 2007
98.833
-0.26
-0.26%
jan 1, 2008
99.33
+0.497
0.5%
jan 1, 2009
98.633
-0.697
-0.7%
jan 1, 2010
98.072
-0.561
-0.57%
jan 1, 2011
98.528
+0.456
0.46%
jan 1, 2012
98.653
+0.125
0.13%
Ranking of countries by current statistics by years


Comments: