29
/
en
AIzaSyAYiBZKx7MnpbEhh9jyipgxe19OcubqV5w
April 1, 2024
147794
Guyana
GUY
true
2
1
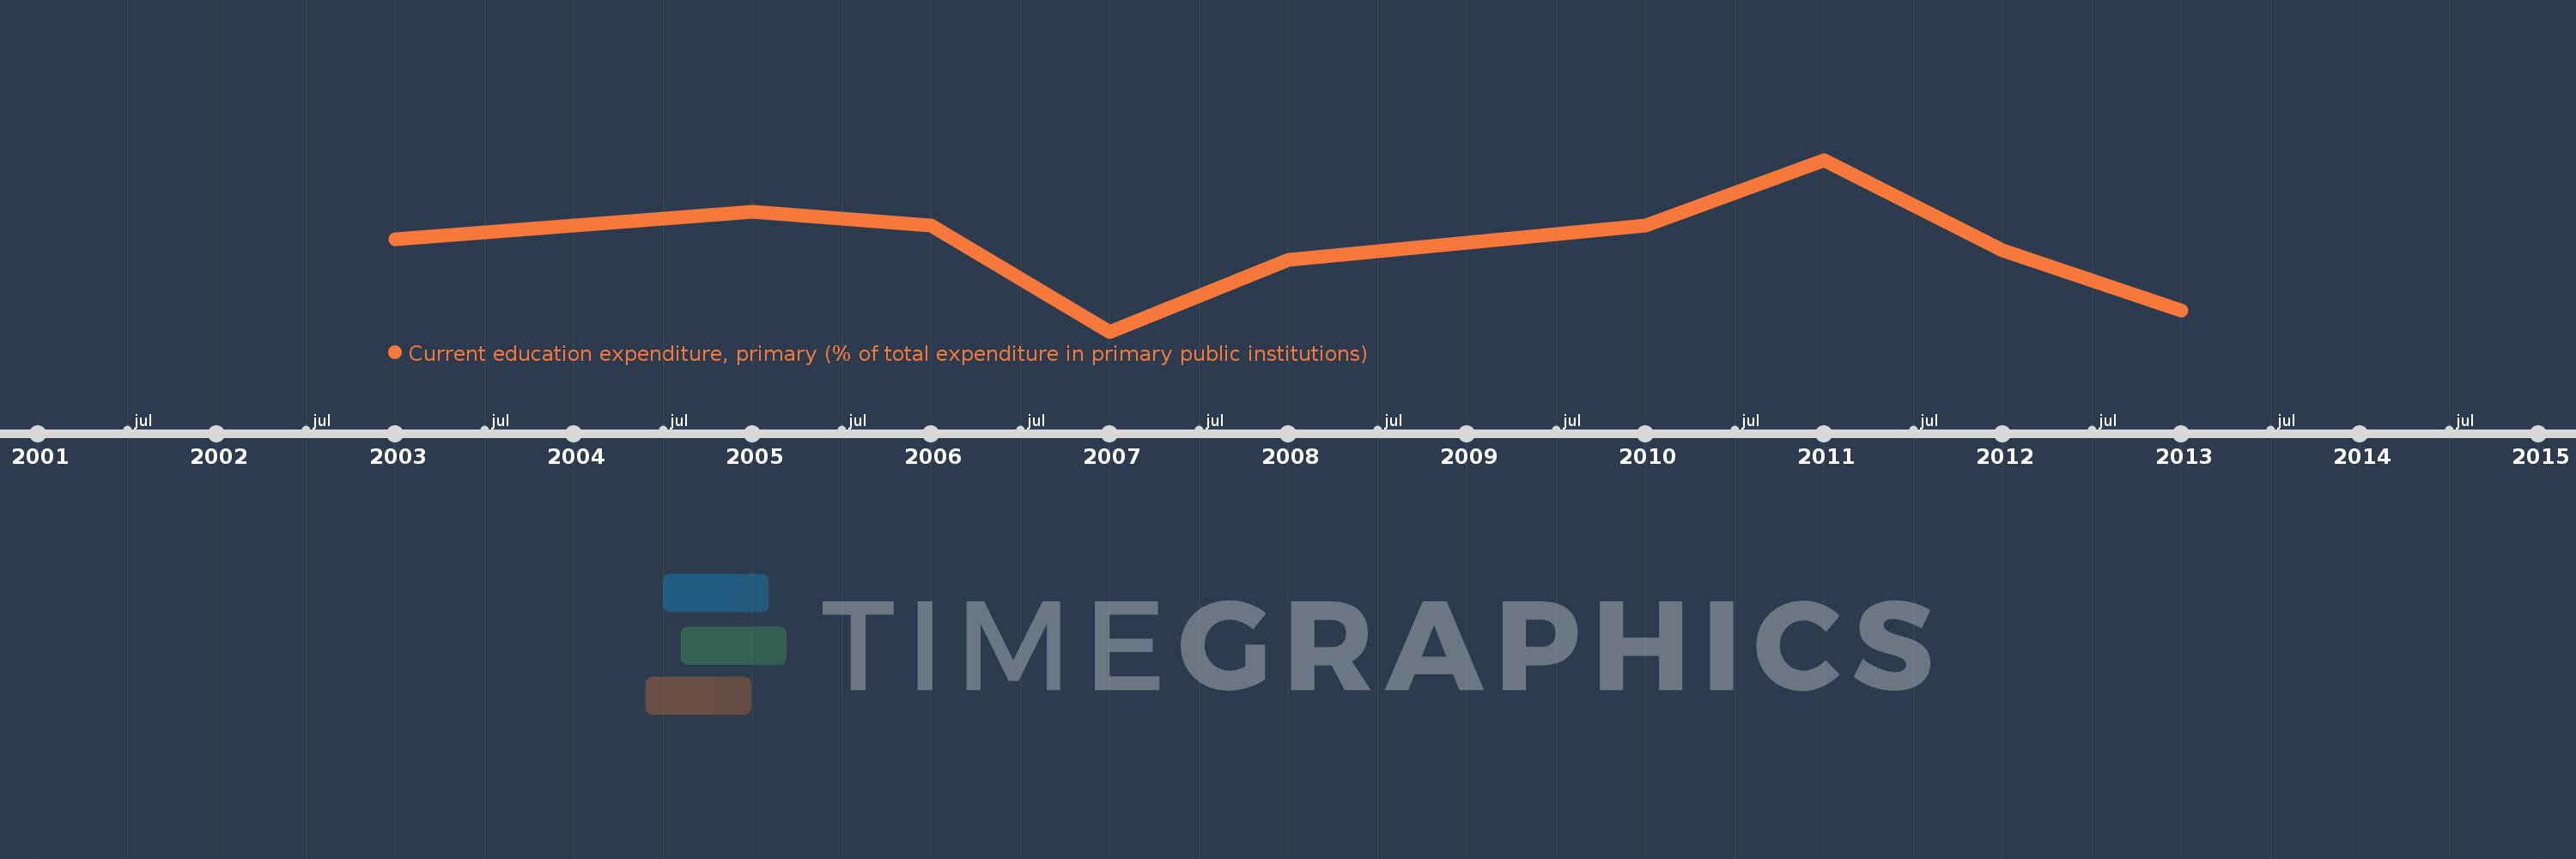
Current education expenditure, primary (% of total expenditure in primary public institutions)
2013,2012,2011,2010,2008,2007,2006,2005,2003
This statistics in other country:
Timeline:
This timeline shows a graph from 2003 to 2013 of Guyana. No data until 2002. Number of actual observations by date: 9.
Source name:
World Development Indicators
Source organization:
United Nations Educational, Scientific, and Cultural Organization (UNESCO) Institute for Statistics.
Categories, topics:
Education
Last updated:
apr 23, 2017
Indicators value changes by year
Minimum:
68.425
jan 1, 2007
Maximum:
94.991
jan 1, 2011
At the date of observation
Value
Absolute change
Change from previous value
jan 1, 2003
82.699
+82.699
0.0%
jan 1, 2005
86.919
+4.22
5.1%
jan 1, 2006
84.842
-2.077
-2.39%
jan 1, 2007
68.425
-16.417
-19.35%
jan 1, 2008
79.571
+11.146
16.29%
jan 1, 2010
84.87
+5.299
6.66%
jan 1, 2011
94.991
+10.121
11.93%
jan 1, 2012
80.93
-14.061
-14.8%
jan 1, 2013
71.71
-9.22
-11.39%
Ranking of countries by current statistics by years


Comments: