29
/
en
AIzaSyAYiBZKx7MnpbEhh9jyipgxe19OcubqV5w
April 1, 2024
33319
European Union
EUU
false
2
1
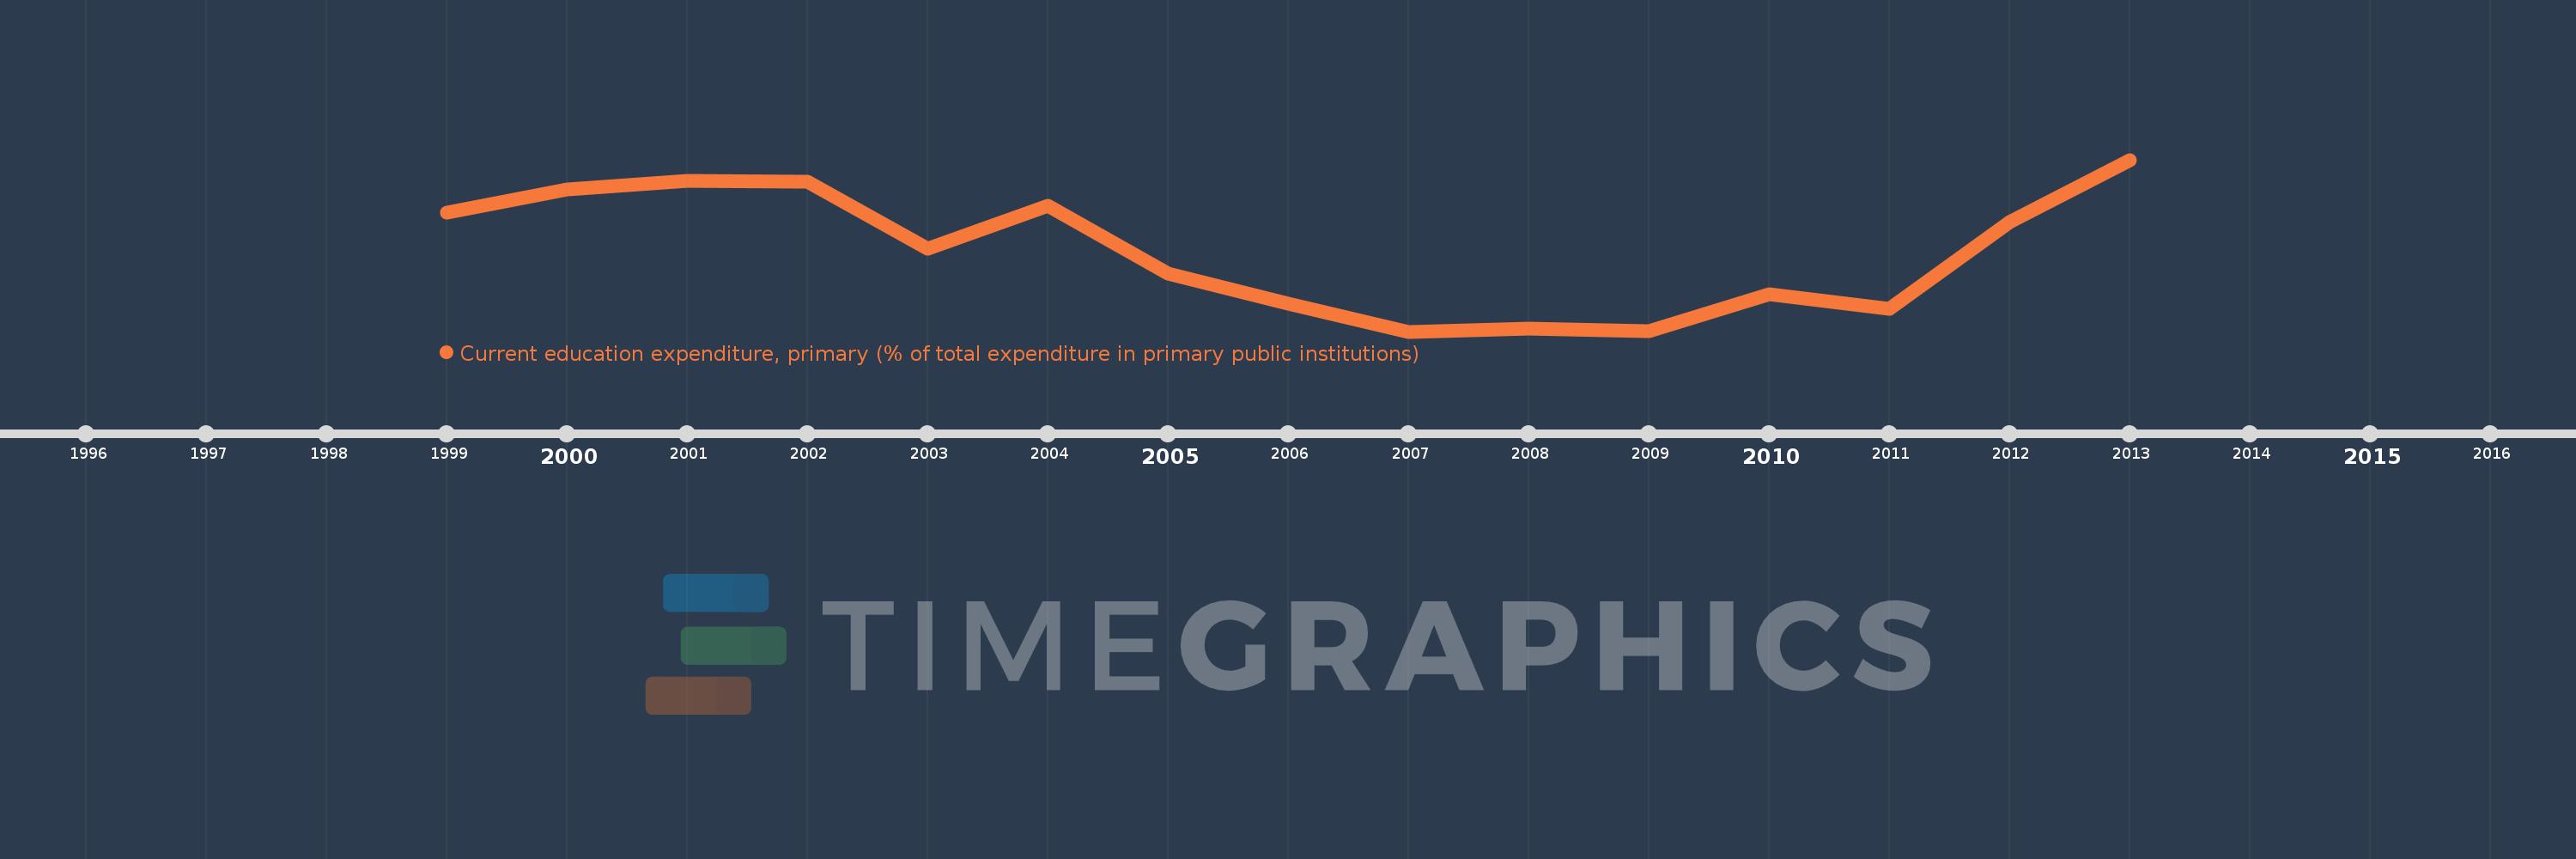
Current education expenditure, primary (% of total expenditure in primary public institutions)
2013,2012,2011,2010,2009,2008,2007,2006,2005,2004,2003,2002,2001,2000,1999
This statistics in other country:
Timeline:
This timeline shows a graph from 1999 to 2013 of European Union. No data until 1998. Number of actual observations by date: 15.
Source name:
World Development Indicators
Source organization:
United Nations Educational, Scientific, and Cultural Organization (UNESCO) Institute for Statistics.
Categories, topics:
Education
Last updated:
apr 23, 2017
Indicators value changes by year
Minimum:
91.787
jan 1, 2007
Maximum:
94.557
jan 1, 2013
At the date of observation
Value
Absolute change
Change from previous value
jan 1, 1999
93.705
+93.705
0.0%
jan 1, 2000
94.086
+0.381
0.41%
jan 1, 2001
94.212
+0.126
0.13%
jan 1, 2002
94.198
-0.014
-0.02%
jan 1, 2003
93.127
-1.07
-1.14%
jan 1, 2004
93.82
+0.693
0.74%
jan 1, 2005
92.727
-1.093
-1.16%
jan 1, 2006
92.236
-0.492
-0.53%
jan 1, 2007
91.787
-0.448
-0.49%
jan 1, 2008
91.83
+0.043
0.05%
jan 1, 2009
91.788
-0.043
-0.05%
jan 1, 2010
92.39
+0.602
0.66%
jan 1, 2011
92.152
-0.238
-0.26%
jan 1, 2012
93.548
+1.396
1.51%
jan 1, 2013
94.557
+1.009
1.08%
Ranking of countries by current statistics by years


Comments: