29
/
en
AIzaSyAYiBZKx7MnpbEhh9jyipgxe19OcubqV5w
April 1, 2024
228289
Romania
ROU
true
2
1
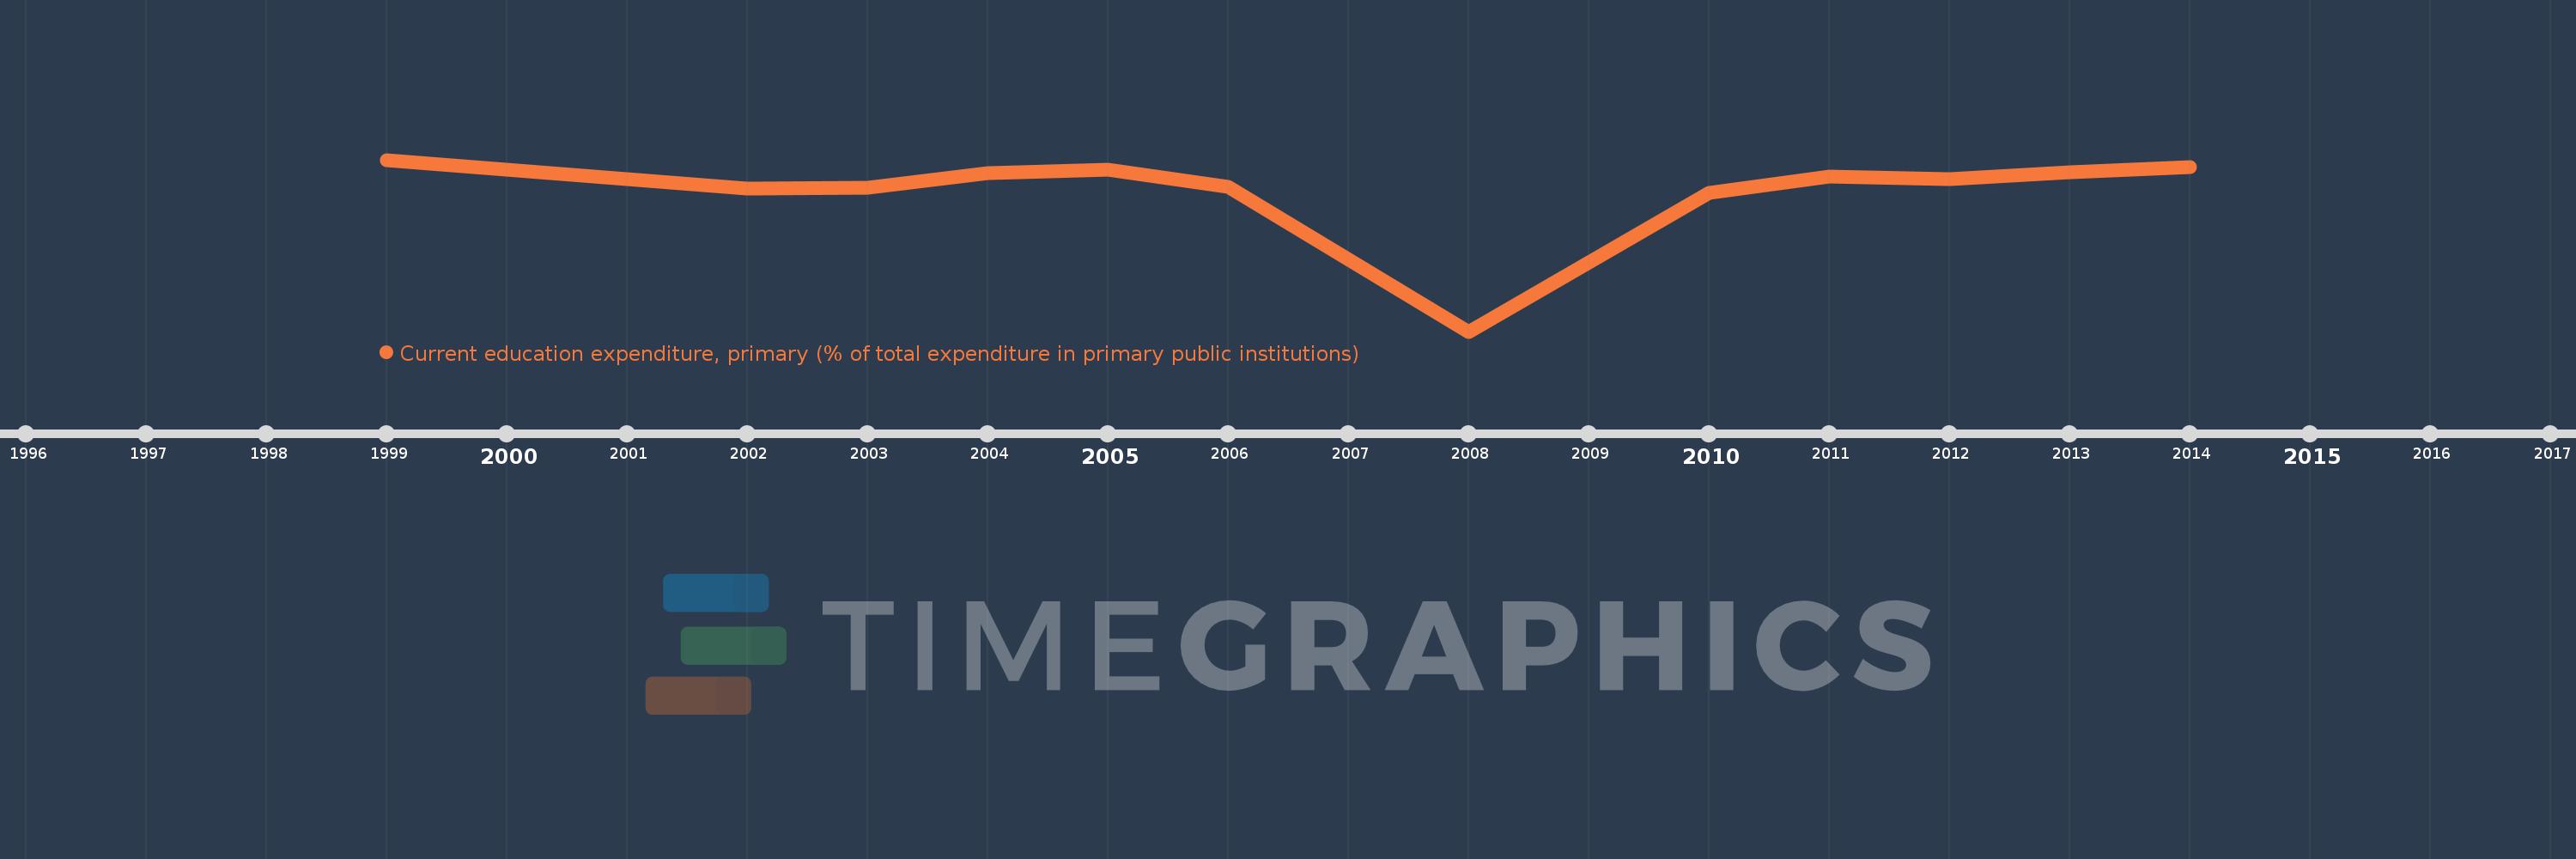
Current education expenditure, primary (% of total expenditure in primary public institutions)
2014,2013,2012,2011,2010,2008,2006,2005,2004,2003,2002,1999
This statistics in other country:
Timeline:
This timeline shows a graph from 1999 to 2014 of Romania. No data until 1998. Number of actual observations by date: 12.
Source name:
World Development Indicators
Source organization:
United Nations Educational, Scientific, and Cultural Organization (UNESCO) Institute for Statistics.
Categories, topics:
Education
Last updated:
apr 23, 2017
Indicators value changes by year
Minimum:
78.616
jan 1, 2008
Maximum:
97.517
jan 1, 1999
At the date of observation
Value
Absolute change
Change from previous value
jan 1, 1999
97.517
+97.517
0.0%
jan 1, 2002
94.32
-3.197
-3.28%
jan 1, 2003
94.474
+0.153
0.16%
jan 1, 2004
96.046
+1.572
1.66%
jan 1, 2005
96.469
+0.423
0.44%
jan 1, 2006
94.533
-1.936
-2.01%
jan 1, 2008
78.616
-15.917
-16.84%
jan 1, 2010
93.905
+15.29
19.45%
jan 1, 2011
95.678
+1.773
1.89%
jan 1, 2012
95.386
-0.292
-0.31%
jan 1, 2013
96.157
+0.771
0.81%
jan 1, 2014
96.717
+0.56
0.58%
Ranking of countries by current statistics by years


Comments: