29
/
en
AIzaSyAYiBZKx7MnpbEhh9jyipgxe19OcubqV5w
April 1, 2024
247391
Spain
ESP
true
2
1
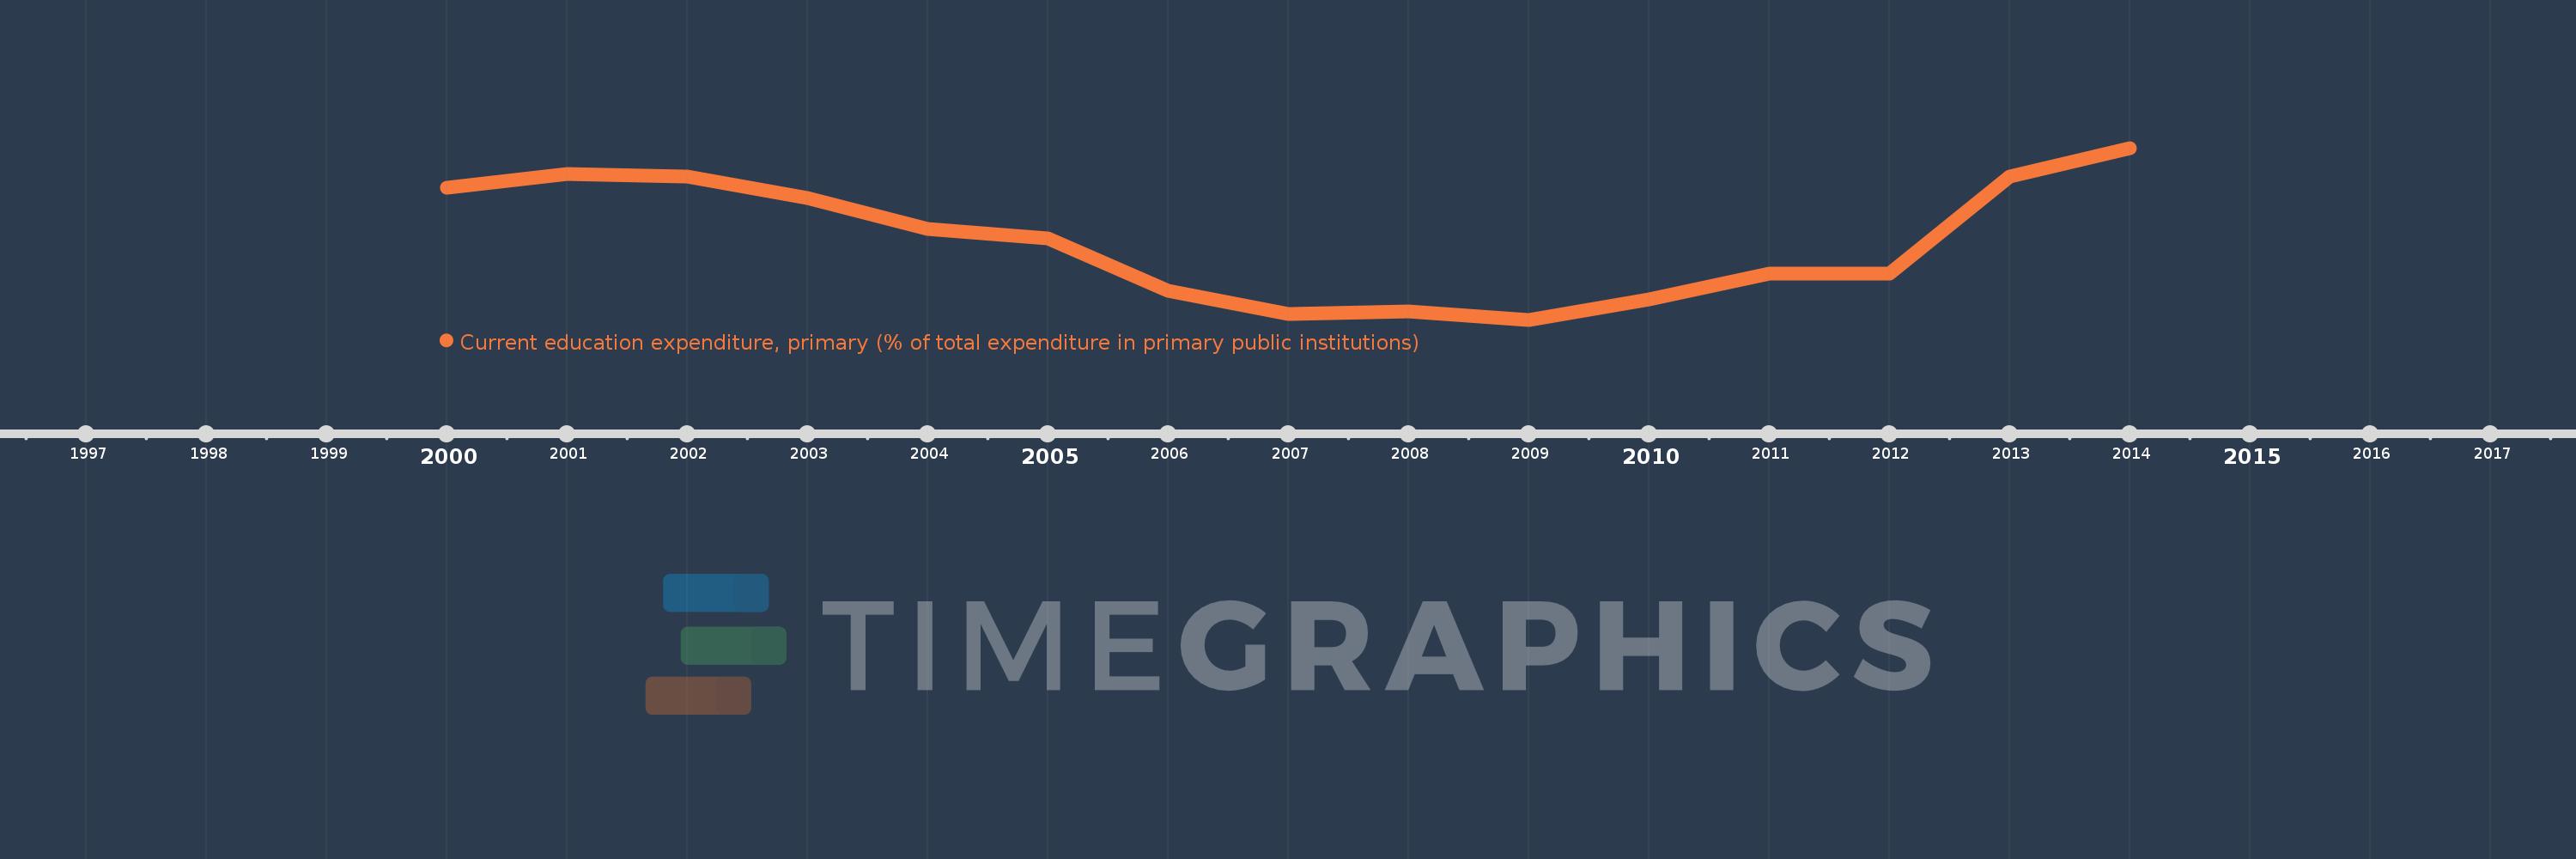
Current education expenditure, primary (% of total expenditure in primary public institutions)
2014,2013,2012,2011,2010,2009,2008,2007,2006,2005,2004,2003,2002,2001,2000
This statistics in other country:
Timeline:
This timeline shows a graph from 2000 to 2014 of Spain. No data until 1999. Number of actual observations by date: 15.
Source name:
World Development Indicators
Source organization:
United Nations Educational, Scientific, and Cultural Organization (UNESCO) Institute for Statistics.
Categories, topics:
Education
Last updated:
apr 23, 2017
Indicators value changes by year
Minimum:
91.296
jan 1, 2009
At the date of observation
Value
Absolute change
Change from previous value
jan 1, 2000
95.569
+95.569
0.0%
jan 1, 2001
95.993
+0.424
0.44%
jan 1, 2002
95.904
-0.089
-0.09%
jan 1, 2003
95.228
-0.675
-0.7%
jan 1, 2004
94.219
-1.009
-1.06%
jan 1, 2005
93.919
-0.3
-0.32%
jan 1, 2006
92.233
-1.686
-1.8%
jan 1, 2007
91.485
-0.747
-0.81%
jan 1, 2008
91.569
+0.084
0.09%
jan 1, 2009
91.296
-0.273
-0.3%
jan 1, 2010
91.943
+0.647
0.71%
jan 1, 2011
92.787
+0.844
0.92%
jan 1, 2012
92.787
0.0
0.0%
jan 1, 2013
95.909
+3.122
3.36%
jan 1, 2014
96.84
+0.931
0.97%
Ranking of countries by current statistics by years


Comments: