29
/
en
AIzaSyAYiBZKx7MnpbEhh9jyipgxe19OcubqV5w
April 1, 2024
30568
Europe & Central Asia
ECS
false
2
1
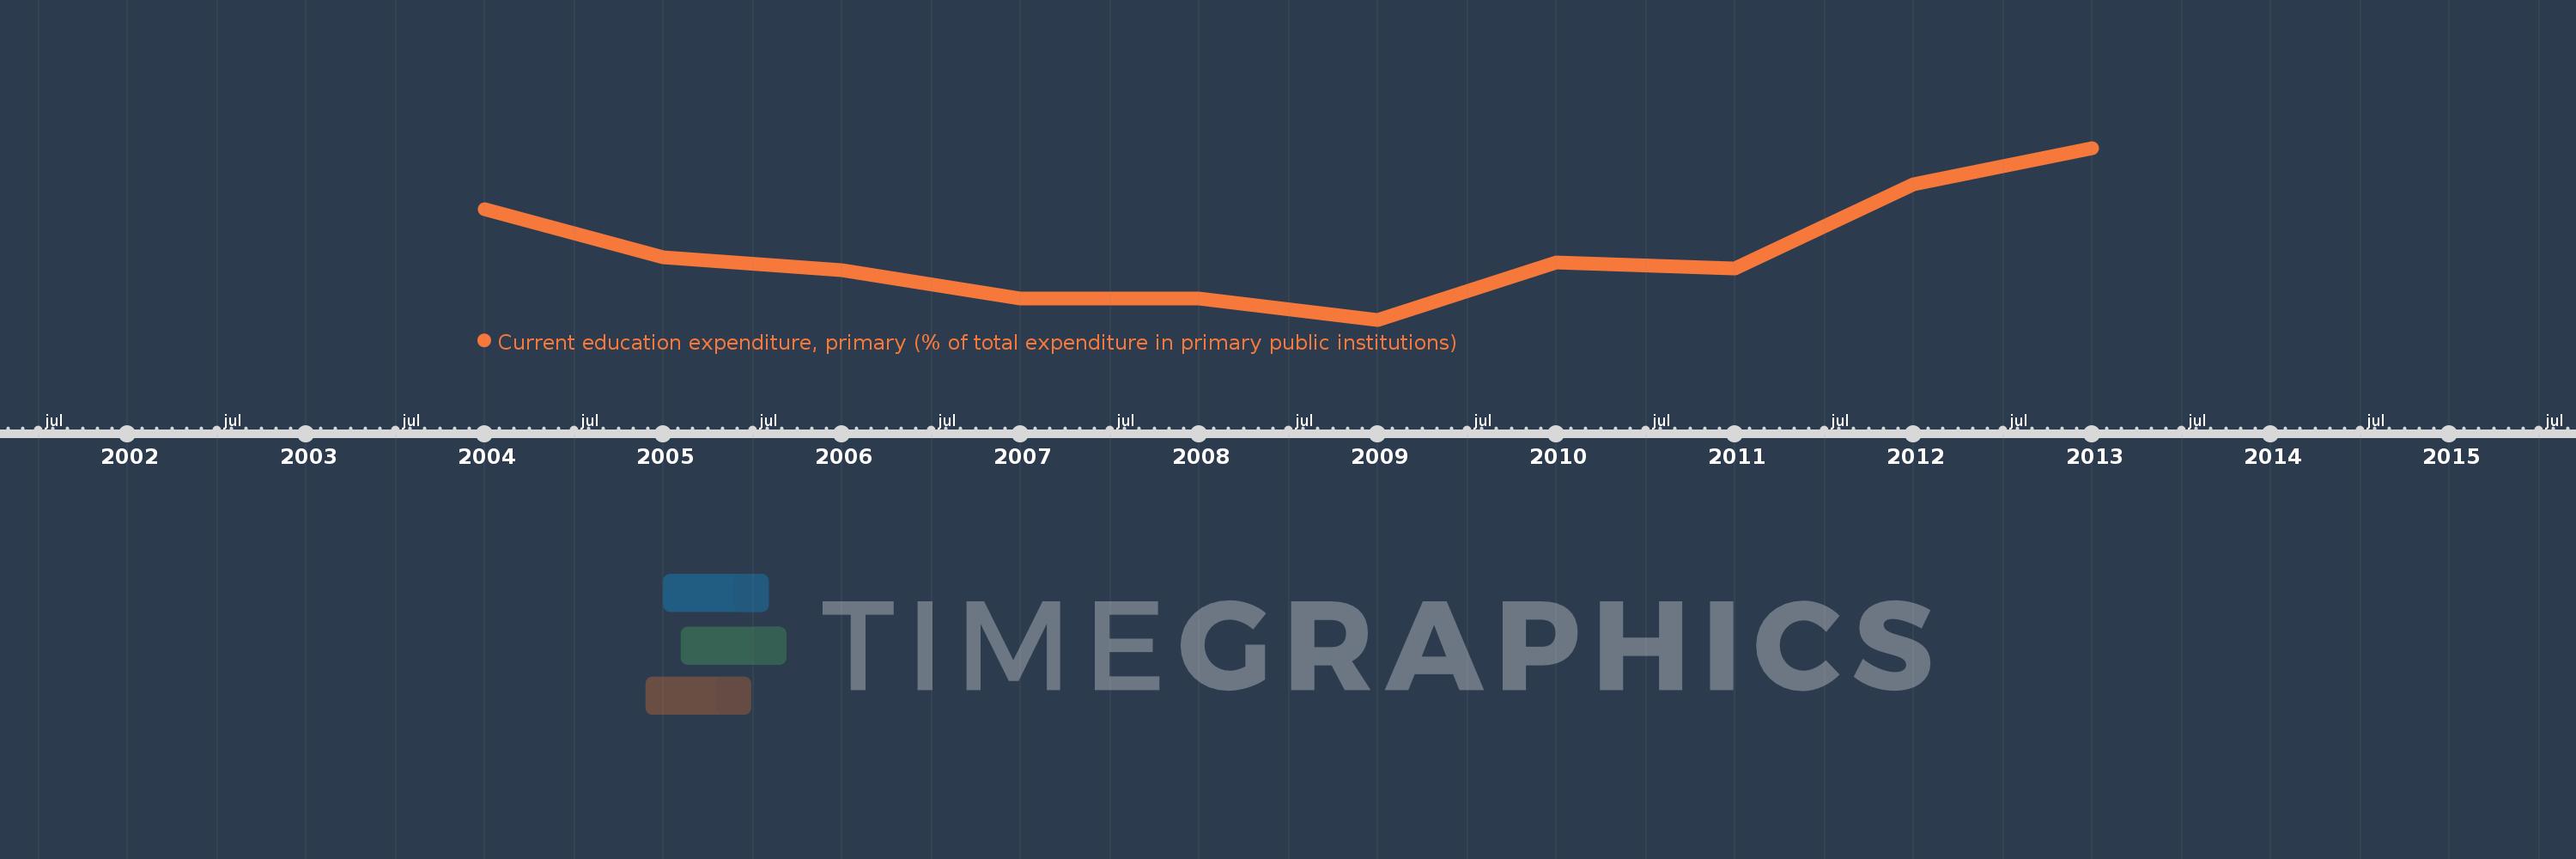
Current education expenditure, primary (% of total expenditure in primary public institutions)
2013,2012,2011,2010,2009,2008,2007,2006,2005,2004
This statistics in other country:
Timeline:
This timeline shows a graph from 2004 to 2013 of Europe & Central Asia. No data until 2003. Number of actual observations by date: 10.
Source name:
World Development Indicators
Source organization:
United Nations Educational, Scientific, and Cultural Organization (UNESCO) Institute for Statistics.
Categories, topics:
Education
Last updated:
apr 23, 2017
Indicators value changes by year
Minimum:
91.296
jan 1, 2009
Maximum:
94.557
jan 1, 2013
At the date of observation
Value
Absolute change
Change from previous value
jan 1, 2004
93.395
+93.395
0.0%
jan 1, 2005
92.48
-0.915
-0.98%
jan 1, 2006
92.233
-0.248
-0.27%
jan 1, 2007
91.703
-0.529
-0.57%
jan 1, 2008
91.691
-0.012
-0.01%
jan 1, 2009
91.296
-0.395
-0.43%
jan 1, 2010
92.39
+1.094
1.2%
jan 1, 2011
92.262
-0.128
-0.14%
jan 1, 2012
93.866
+1.603
1.74%
jan 1, 2013
94.557
+0.691
0.74%
Ranking of countries by current statistics by years


Comments: