29
/
en
AIzaSyAYiBZKx7MnpbEhh9jyipgxe19OcubqV5w
April 1, 2024
69630
Argentina
ARG
true
2
1
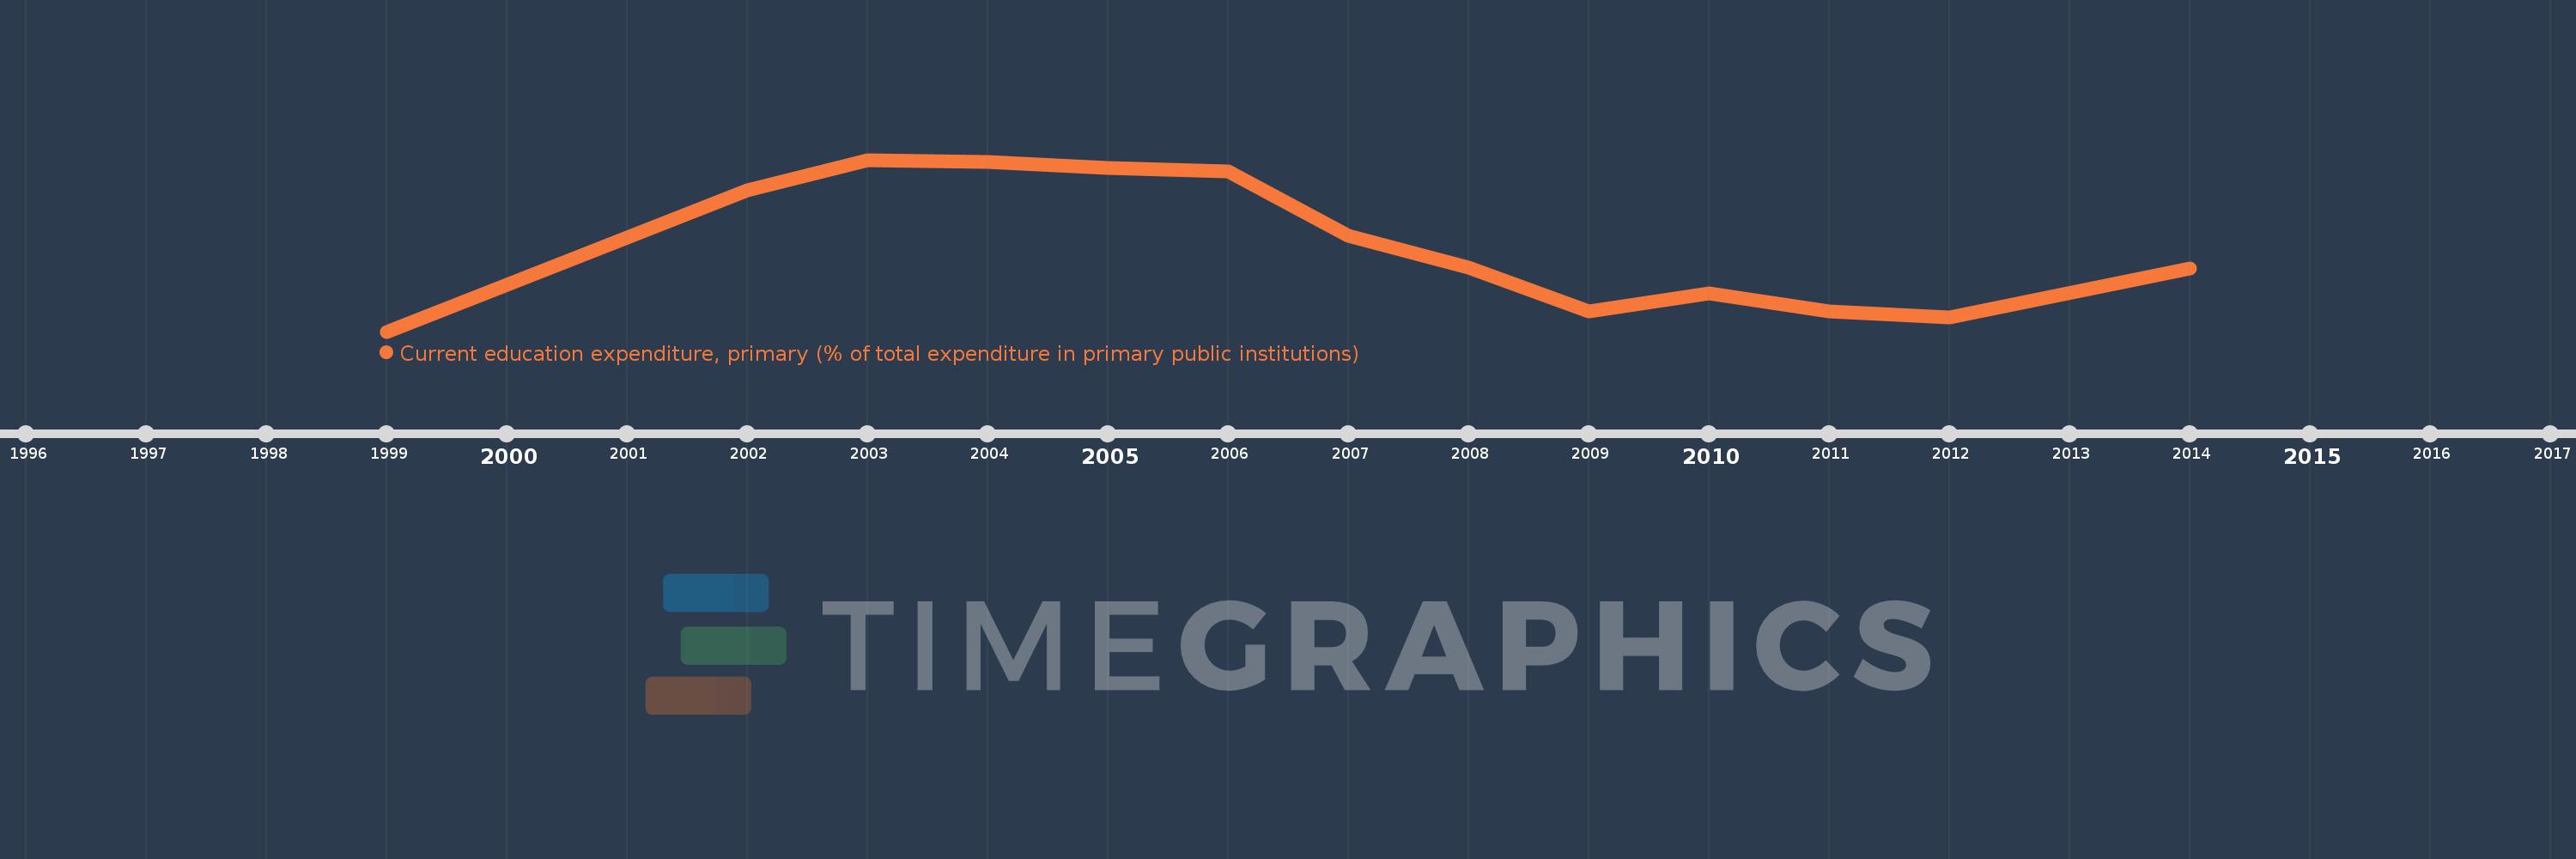
Current education expenditure, primary (% of total expenditure in primary public institutions)
2014,2012,2011,2010,2009,2008,2007,2006,2005,2004,2003,2002,1999
This statistics in other country:
Timeline:
This timeline shows a graph from 1999 to 2014 of Argentina. No data until 1998. Number of actual observations by date: 13.
Source name:
World Development Indicators
Source organization:
United Nations Educational, Scientific, and Cultural Organization (UNESCO) Institute for Statistics.
Categories, topics:
Education
Last updated:
apr 23, 2017
Indicators value changes by year
Minimum:
94.353
jan 1, 1999
Maximum:
99.195
jan 1, 2003
At the date of observation
Value
Absolute change
Change from previous value
jan 1, 1999
94.353
+94.353
0.0%
jan 1, 2002
98.327
+3.974
4.21%
jan 1, 2003
99.195
+0.868
0.88%
jan 1, 2004
99.145
-0.051
-0.05%
jan 1, 2005
98.968
-0.176
-0.18%
jan 1, 2006
98.879
-0.09
-0.09%
jan 1, 2007
97.057
-1.822
-1.84%
jan 1, 2008
96.168
-0.889
-0.92%
jan 1, 2009
94.933
-1.235
-1.28%
jan 1, 2010
95.429
+0.496
0.52%
jan 1, 2011
94.919
-0.511
-0.54%
jan 1, 2012
94.747
-0.172
-0.18%
jan 1, 2014
96.135
+1.389
1.47%
Ranking of countries by current statistics by years


Comments: