29
/
en
AIzaSyAYiBZKx7MnpbEhh9jyipgxe19OcubqV5w
April 1, 2024
90957
Brazil
BRA
true
2
1
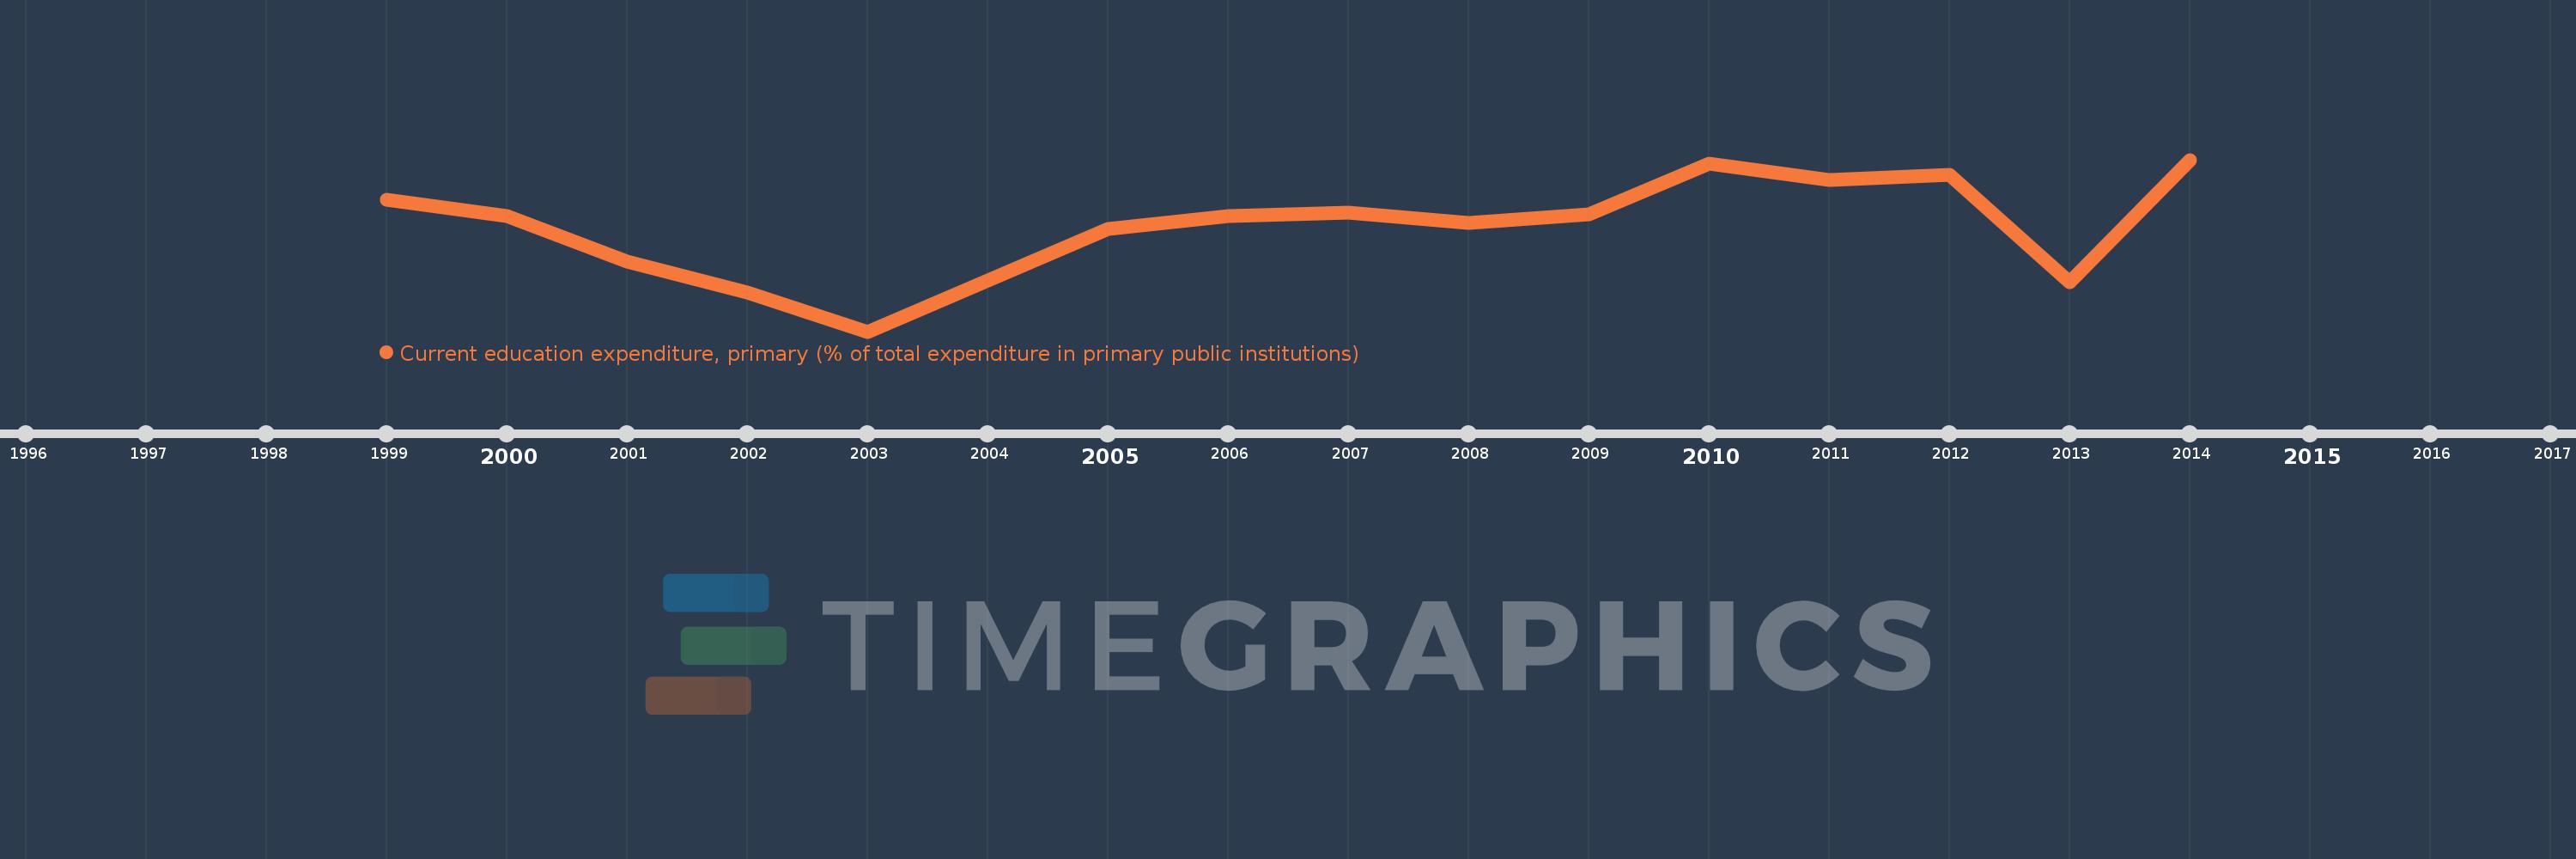
Current education expenditure, primary (% of total expenditure in primary public institutions)
2014,2013,2012,2011,2010,2009,2008,2007,2006,2005,2003,2002,2001,2000,1999
This statistics in other country:
Timeline:
This timeline shows a graph from 1999 to 2014 of Brazil. No data until 1998. Number of actual observations by date: 15.
Source name:
World Development Indicators
Source organization:
United Nations Educational, Scientific, and Cultural Organization (UNESCO) Institute for Statistics.
Categories, topics:
Education
Last updated:
apr 23, 2017
Indicators value changes by year
Minimum:
90.003
jan 1, 2003
Maximum:
94.719
jan 1, 2014
At the date of observation
Value
Absolute change
Change from previous value
jan 1, 1999
93.611
+93.611
0.0%
jan 1, 2000
93.175
-0.436
-0.47%
jan 1, 2001
91.917
-1.259
-1.35%
jan 1, 2002
91.078
-0.839
-0.91%
jan 1, 2003
90.003
-1.075
-1.18%
jan 1, 2005
92.831
+2.828
3.14%
jan 1, 2006
93.174
+0.343
0.37%
jan 1, 2007
93.266
+0.091
0.1%
jan 1, 2008
92.985
-0.281
-0.3%
jan 1, 2009
93.221
+0.237
0.25%
jan 1, 2010
94.604
+1.383
1.48%
jan 1, 2011
94.158
-0.447
-0.47%
jan 1, 2012
94.317
+0.16
0.17%
jan 1, 2013
91.351
-2.966
-3.14%
jan 1, 2014
94.719
+3.368
3.69%
Ranking of countries by current statistics by years


Comments: