29
/
en
AIzaSyAYiBZKx7MnpbEhh9jyipgxe19OcubqV5w
April 1, 2024
230871
Rwanda
RWA
true
2
1
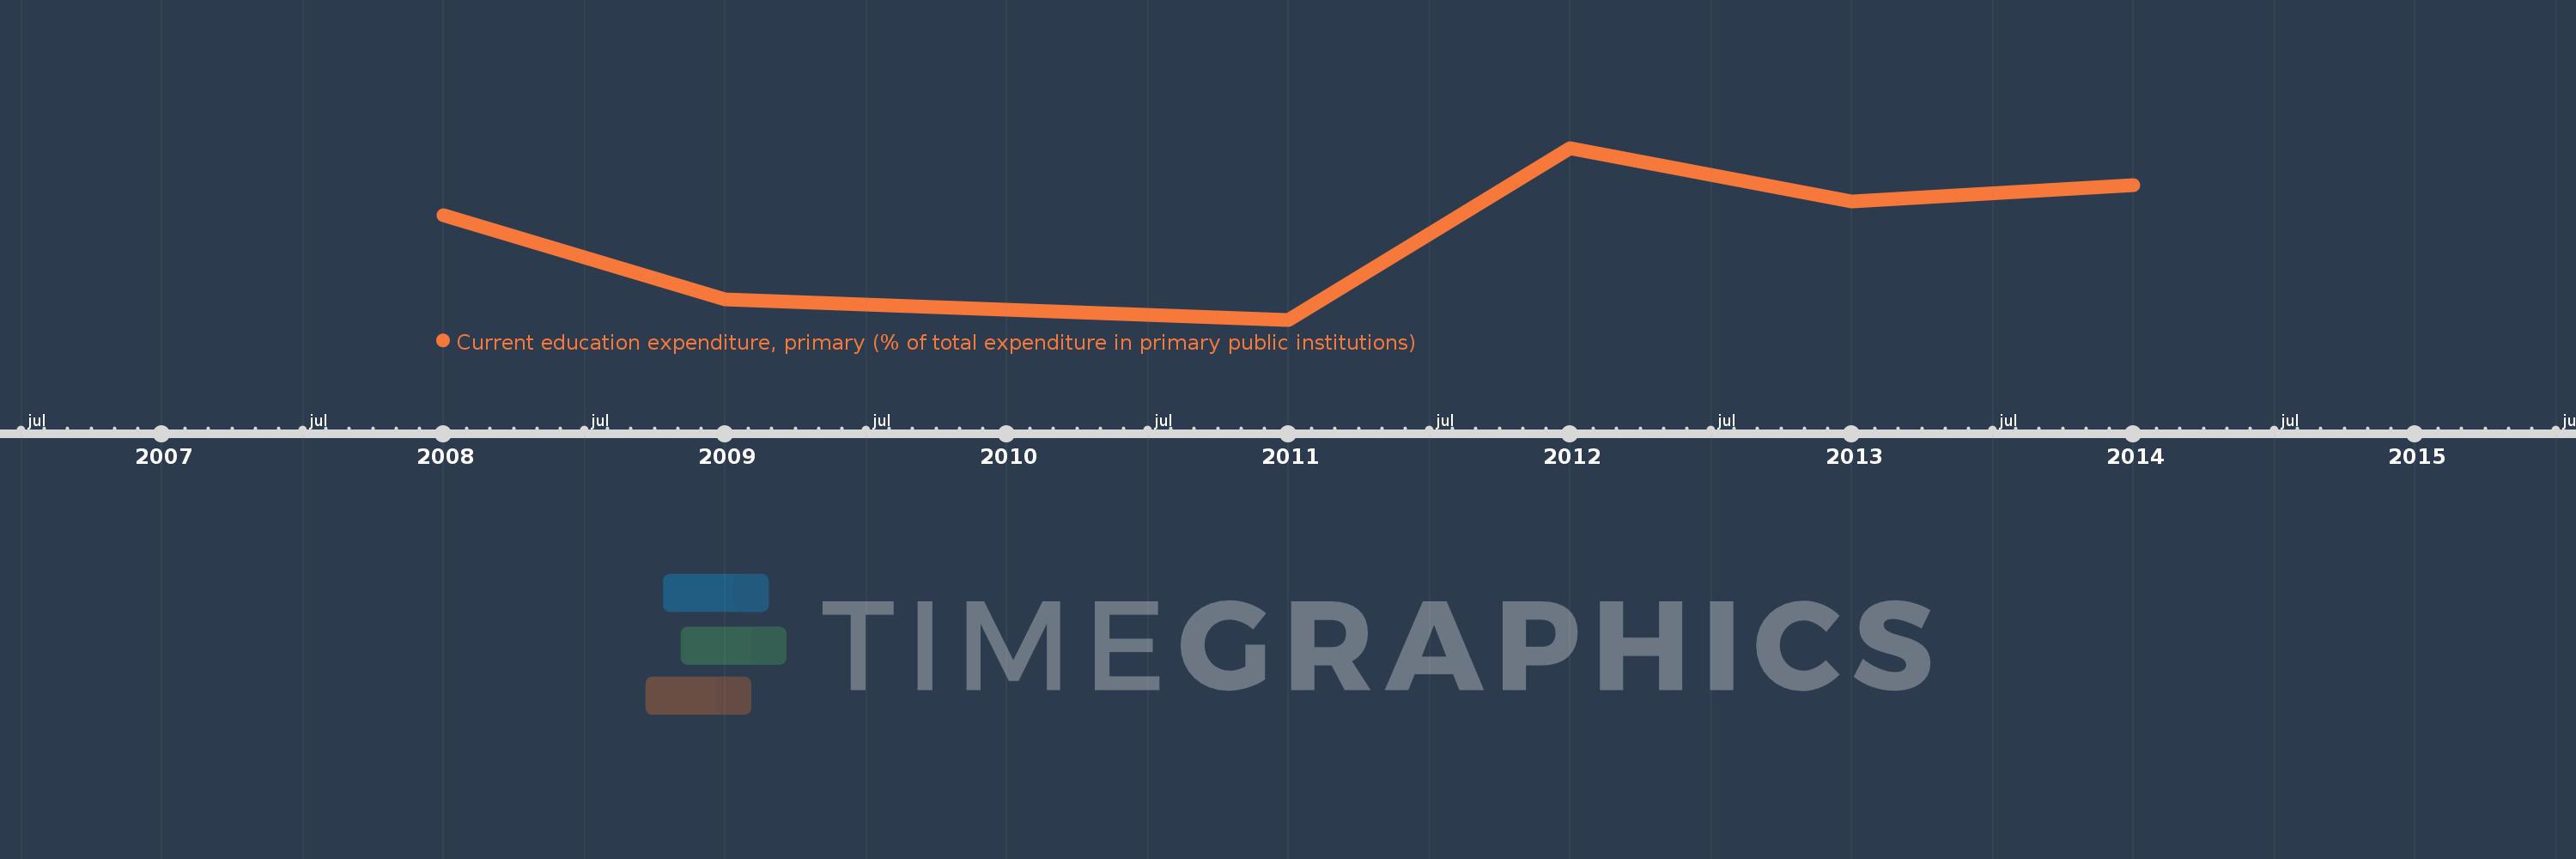
Current education expenditure, primary (% of total expenditure in primary public institutions)
2014,2013,2012,2011,2009,2008
This statistics in other country:
Timeline:
This timeline shows a graph from 2008 to 2014 of Rwanda. No data until 2007. Number of actual observations by date: 6.
Source name:
World Development Indicators
Source organization:
United Nations Educational, Scientific, and Cultural Organization (UNESCO) Institute for Statistics.
Categories, topics:
Education
Last updated:
apr 23, 2017
Indicators value changes by year
Maximum:
99.142
jan 1, 2012
At the date of observation
Value
Absolute change
Change from previous value
jan 1, 2008
92.58
+92.58
0.0%
jan 1, 2009
84.455
-8.124
-8.78%
jan 1, 2011
82.47
-1.985
-2.35%
jan 1, 2012
99.142
+16.671
20.21%
jan 1, 2013
93.943
-5.198
-5.24%
jan 1, 2014
95.494
+1.551
1.65%
Ranking of countries by current statistics by years


Comments: