29
/
en
AIzaSyAYiBZKx7MnpbEhh9jyipgxe19OcubqV5w
April 1, 2024
261371
Tanzania
TZA
true
2
1
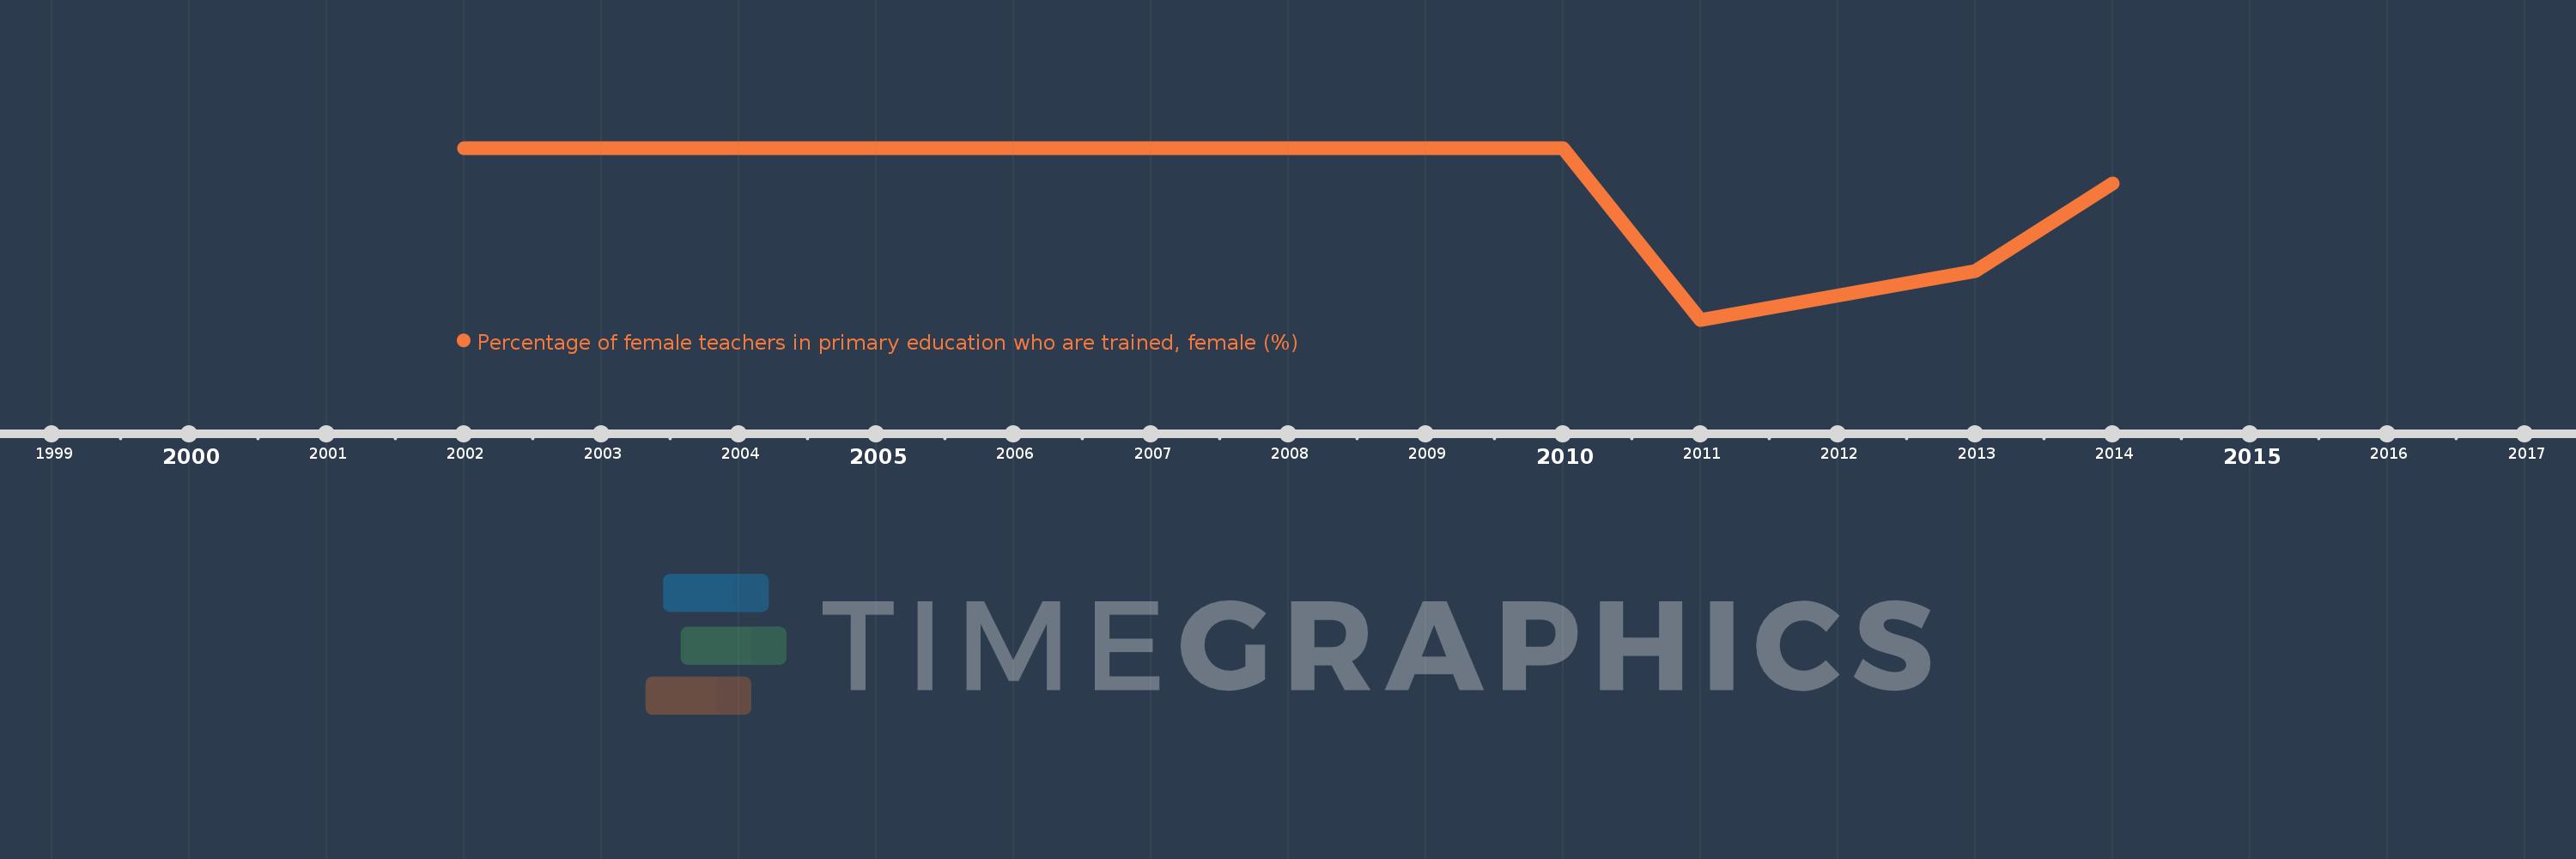
Percentage of female teachers in primary education who are trained, female (%)
2014,2013,2011,2010,2008,2007,2006,2005,2003,2002
This statistics in other country:
Timeline:
This timeline shows a graph from 2002 to 2014 of Tanzania. No data until 2001. Number of actual observations by date: 10.
Source name:
World Development Indicators
Source organization:
United Nations Educational, Scientific, and Cultural Organization (UNESCO) Institute for Statistics.
Categories, topics:
Education, Gender
Last updated:
apr 23, 2017
Indicators value changes by year
Minimum:
95.672
jan 1, 2011
At the date of observation
Value
Absolute change
Change from previous value
jan 1, 2002
100.0
+100.0
0.0%
jan 1, 2003
100.0
0.0
0.0%
jan 1, 2005
100.0
0.0
0.0%
jan 1, 2006
100.0
0.0
0.0%
jan 1, 2007
100.0
0.0
0.0%
jan 1, 2008
100.0
0.0
0.0%
jan 1, 2010
100.0
0.0
0.0%
jan 1, 2011
95.672
-4.328
-4.33%
jan 1, 2013
96.89
+1.218
1.27%
jan 1, 2014
99.106
+2.216
2.29%
Ranking of countries by current statistics by years


Comments: