29
/
en
AIzaSyAYiBZKx7MnpbEhh9jyipgxe19OcubqV5w
April 1, 2024
112723
Costa Rica
CRI
true
2
1
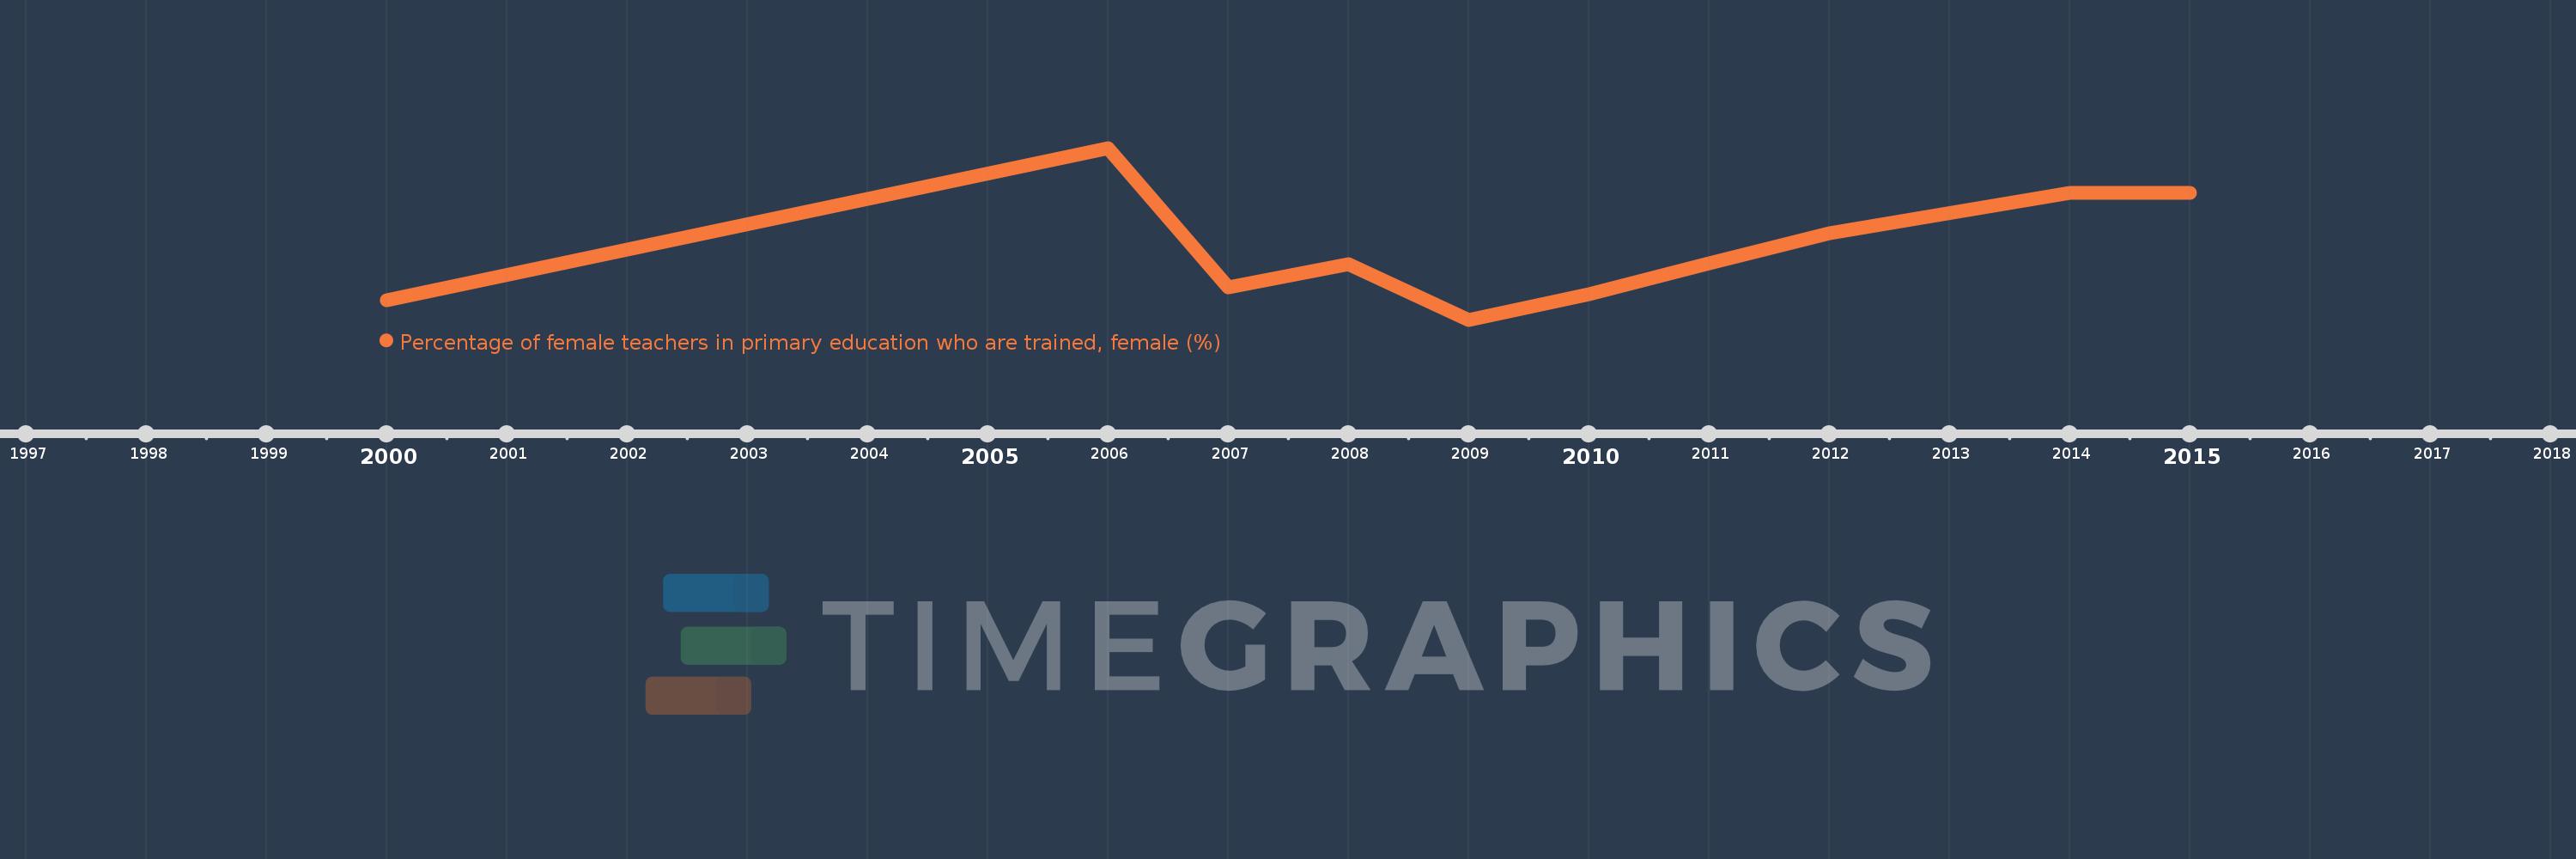
Percentage of female teachers in primary education who are trained, female (%)
2015,2014,2012,2011,2010,2009,2008,2007,2006,2000
This statistics in other country:
Timeline:
This timeline shows a graph from 2000 to 2015 of Costa Rica. No data until 1999. Number of actual observations by date: 10.
Source name:
World Development Indicators
Source organization:
United Nations Educational, Scientific, and Cultural Organization (UNESCO) Institute for Statistics.
Categories, topics:
Education, Gender
Last updated:
apr 23, 2017
Indicators value changes by year
Minimum:
85.917
jan 1, 2009
At the date of observation
Value
Absolute change
Change from previous value
jan 1, 2000
87.141
+87.141
0.0%
jan 1, 2006
96.81
+9.669
11.1%
jan 1, 2007
87.963
-8.847
-9.14%
jan 1, 2008
89.414
+1.451
1.65%
jan 1, 2009
85.917
-3.497
-3.91%
jan 1, 2010
87.52
+1.603
1.87%
jan 1, 2011
89.48
+1.96
2.24%
jan 1, 2012
91.424
+1.945
2.17%
jan 1, 2014
93.984
+2.56
2.8%
jan 1, 2015
93.984
+0.0
0.0%
Ranking of countries by current statistics by years


Comments: