29
/
en
AIzaSyAYiBZKx7MnpbEhh9jyipgxe19OcubqV5w
April 1, 2024
86367
Bhutan
BTN
true
2
1
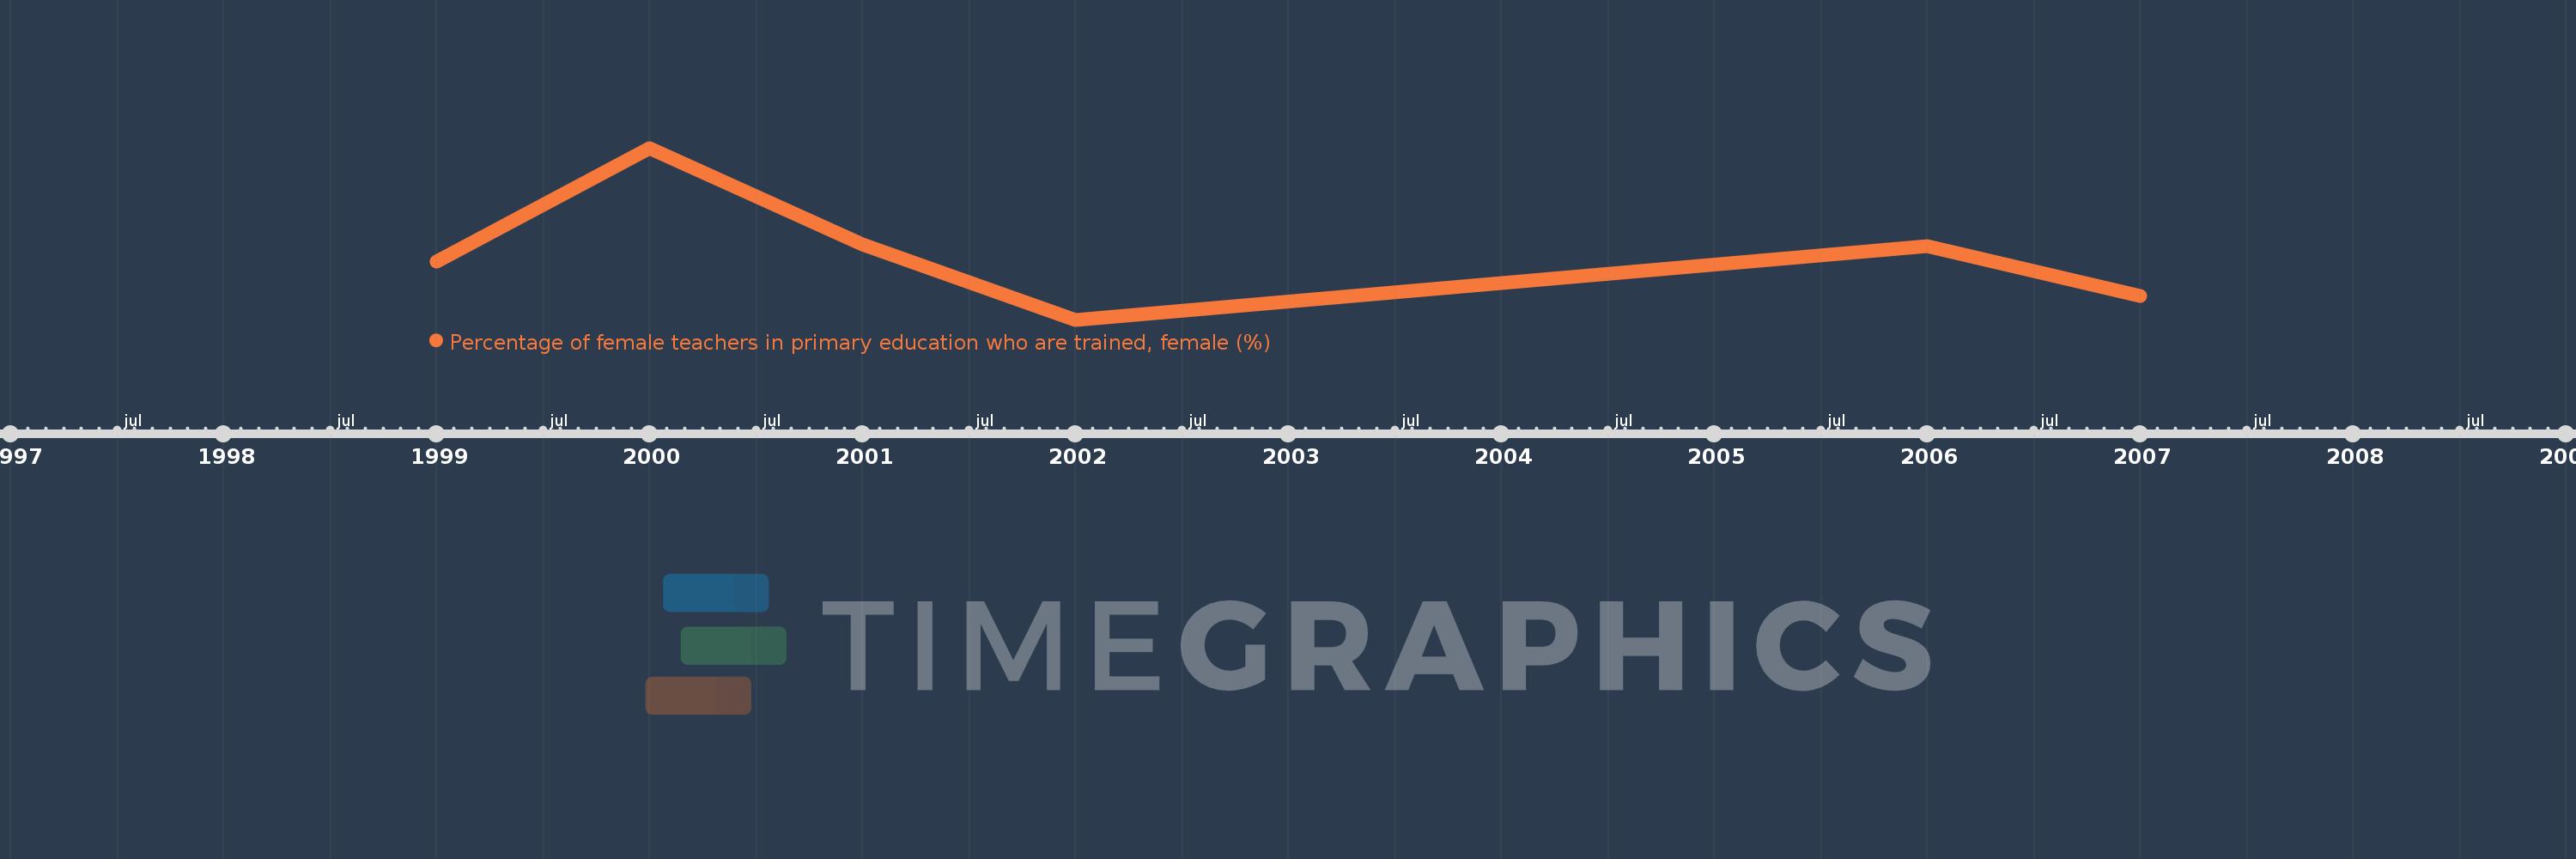
Percentage of female teachers in primary education who are trained, female (%)
2007,2006,2002,2001,2000,1999
This statistics in other country:
Timeline:
This timeline shows a graph from 1999 to 2007 of Bhutan. No data until 1998. Number of actual observations by date: 6.
Source name:
World Development Indicators
Source organization:
United Nations Educational, Scientific, and Cultural Organization (UNESCO) Institute for Statistics.
Categories, topics:
Education, Gender
Last updated:
apr 23, 2017
Indicators value changes by year
Minimum:
90.736
jan 1, 2002
At the date of observation
Value
Absolute change
Change from previous value
jan 1, 1999
93.893
+93.893
0.0%
jan 1, 2000
100.0
+6.107
6.5%
jan 1, 2001
94.811
-5.189
-5.19%
jan 1, 2002
90.736
-4.075
-4.3%
jan 1, 2006
94.685
+3.949
4.35%
jan 1, 2007
92.034
-2.651
-2.8%
Ranking of countries by current statistics by years


Comments: