29
/
en
AIzaSyAYiBZKx7MnpbEhh9jyipgxe19OcubqV5w
April 1, 2024
90246
Botswana
BWA
true
2
1
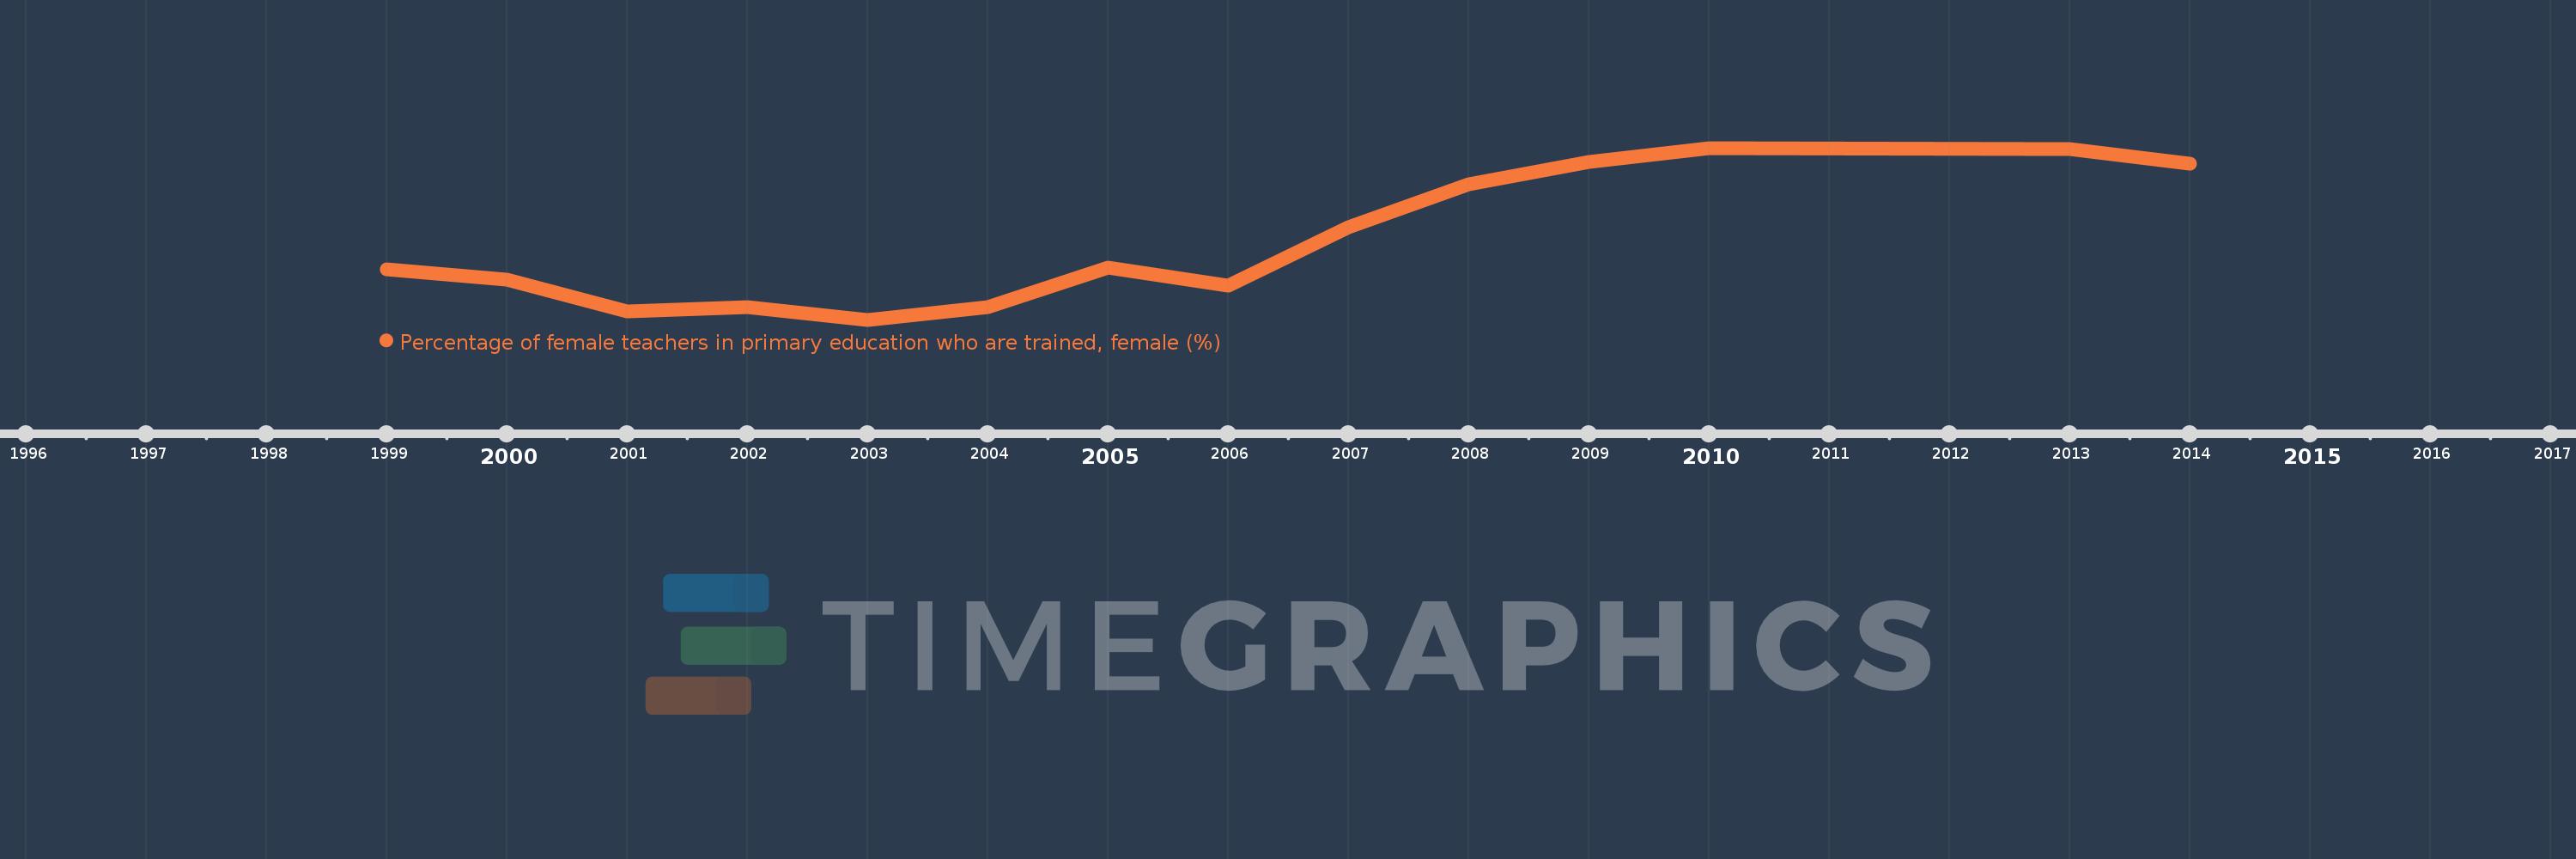
Percentage of female teachers in primary education who are trained, female (%)
2014,2013,2010,2009,2008,2007,2006,2005,2004,2003,2002,2001,2000,1999
This statistics in other country:
Timeline:
This timeline shows a graph from 1999 to 2014 of Botswana. No data until 1998. Number of actual observations by date: 14.
Source name:
World Development Indicators
Source organization:
United Nations Educational, Scientific, and Cultural Organization (UNESCO) Institute for Statistics.
Categories, topics:
Education, Gender
Last updated:
apr 23, 2017
Indicators value changes by year
Minimum:
90.094
jan 1, 2003
Maximum:
99.554
jan 1, 2010
At the date of observation
Value
Absolute change
Change from previous value
jan 1, 1999
92.892
+92.892
0.0%
jan 1, 2000
92.284
-0.608
-0.65%
jan 1, 2001
90.569
-1.715
-1.86%
jan 1, 2002
90.788
+0.219
0.24%
jan 1, 2003
90.094
-0.693
-0.76%
jan 1, 2004
90.784
+0.69
0.77%
jan 1, 2005
92.985
+2.201
2.42%
jan 1, 2006
91.992
-0.993
-1.07%
jan 1, 2007
95.175
+3.183
3.46%
jan 1, 2008
97.569
+2.394
2.52%
jan 1, 2009
98.803
+1.234
1.26%
jan 1, 2010
99.554
+0.752
0.76%
jan 1, 2013
99.48
-0.074
-0.07%
jan 1, 2014
98.711
-0.769
-0.77%
Ranking of countries by current statistics by years


Comments: