29
/
en
AIzaSyAYiBZKx7MnpbEhh9jyipgxe19OcubqV5w
April 1, 2024
267259
Trinidad and Tobago
TTO
true
2
1
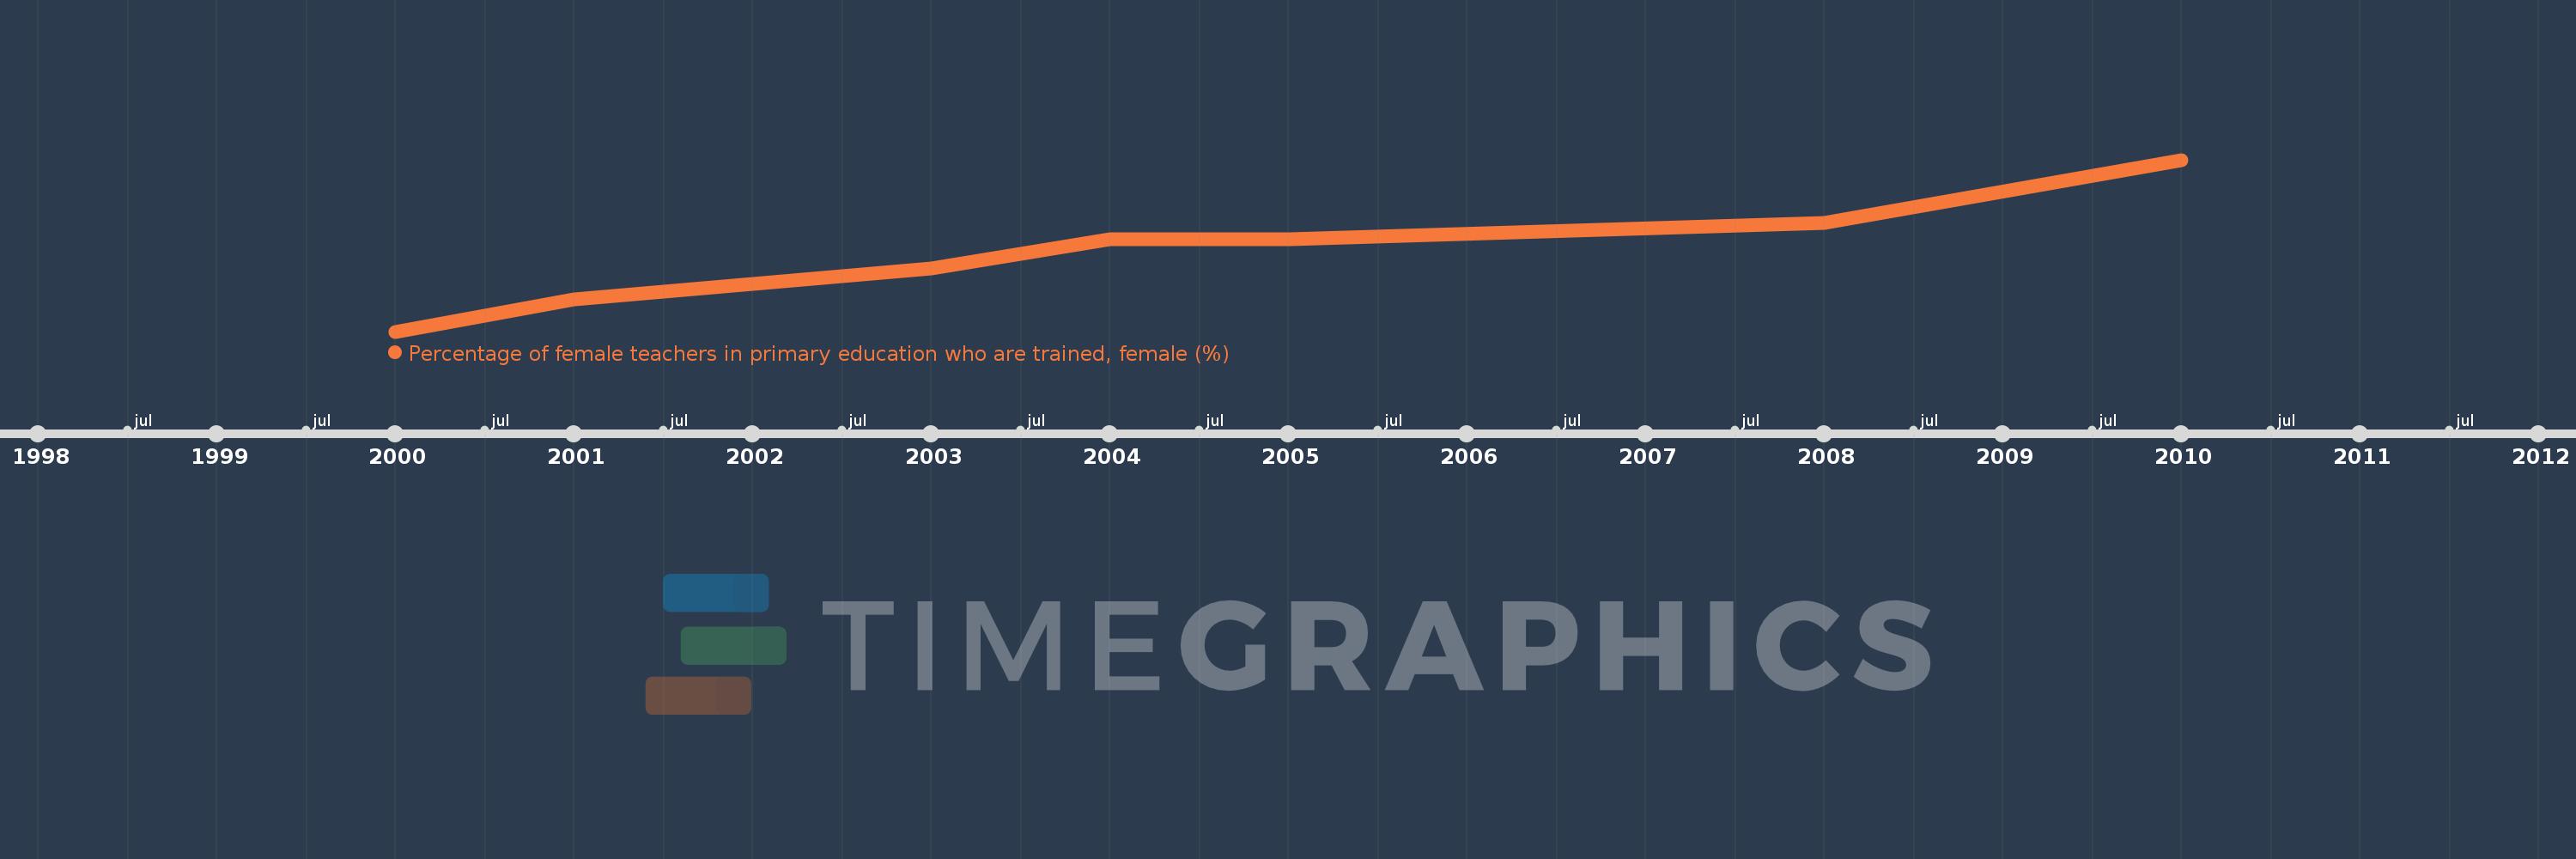
Percentage of female teachers in primary education who are trained, female (%)
2010,2008,2005,2004,2003,2002,2001,2000
This statistics in other country:
Timeline:
This timeline shows a graph from 2000 to 2010 of Trinidad and Tobago. No data until 1999. Number of actual observations by date: 8.
Source name:
World Development Indicators
Source organization:
United Nations Educational, Scientific, and Cultural Organization (UNESCO) Institute for Statistics.
Categories, topics:
Education, Gender
Last updated:
apr 23, 2017
Indicators value changes by year
Minimum:
70.664
jan 1, 2000
Maximum:
95.823
jan 1, 2010
At the date of observation
Value
Absolute change
Change from previous value
jan 1, 2000
70.664
+70.664
0.0%
jan 1, 2001
75.402
+4.738
6.71%
jan 1, 2002
77.617
+2.214
2.94%
jan 1, 2003
79.96
+2.344
3.02%
jan 1, 2004
84.215
+4.255
5.32%
jan 1, 2005
84.215
0.0
0.0%
jan 1, 2008
86.61
+2.395
2.84%
jan 1, 2010
95.823
+9.212
10.64%
Ranking of countries by current statistics by years


Comments: